<< Chapter < Page
  Digital signal processing - dsp     Page 12 / 14
Chapter >> Page >

Although it wasn't apparent in Figure 7 , Figure 9 shows that the real part of the spectrum takes on the shape of a cosine wave, while the imaginary part ofthe spectrum takes on the shape of a sine wave as a result of the time delay of the impulse.

The phase shift is still linear across frequency as would be expected, but the slope is now five times greater than the slope of the phase shift in Figure 7 .

(Note that the time delay is five times greater in Figure 9 . Note also that the plot of the phase angle wraps around from +180 degrees to -180degrees each time the phase angle reaches +180 degrees. This produces the saw tooth effect shown in the bottom plot in Figure 9 .)

A boxcar pulse

If an impulse is the simplest kind of pulse to generate digitally, a boxcar pulse is probably the next simplest. A "boxcar" pulse is one where severaladjacent samples have the same non-zero value. Let's examine the case for an eleven-sample boxcar pulse. The new parameters for this case are shown in Figure 10 .

Figure 10. A boxcar pulse.
Parameters read from file Data length: 400Pulse length: 11 Sample for zero time: 0Lower frequency bound: 0.0 Upper frequency bound: 0.5Pulse Values 40.040.0 40.040.0 40.040.0 40.040.0 40.040.0 40.0

The spectral analysis output for the boxcar pulse

The spectral analysis output for the eleven-sample boxcar pulse is shown in Figure 11 .

Figure 11. Spectral analysis of 11-sample boxcar pulse.
missing image

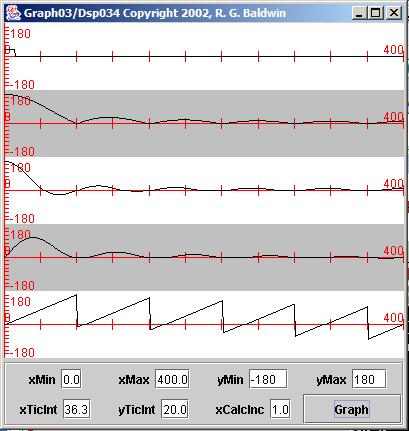
The pulse itself is relatively easy to see on the leftmost end of the top plot.

The amplitude spectrum

The amplitude spectrum is no longer flat. Rather it has a peak at zero frequency and goes to zero between frequency sample 72 and frequency sample 73.

Without getting into the technical details, I will simply tell you that the location of the point where it goes to zero is related to the reciprocal of thepulse width. If that sounds familiar, it is because we encountered similar situations involving bandwidth in the module titled Spectrum Analysis using Java, Frequency Resolution versus Data Length .

In fact, the shape of the amplitude spectrum is a familiar (sin x)/x curve with the negative lobes flipped up and turned into positive lobes instead.

The phase angle is still linear with frequency although it now shows some discontinuities at those frequencies where the amplitude spectrum touches zero.

The magic of non real-time digital processing

When working with (recorded non real-time) digital time series, it is not only possible to physically shift pulses forward or backward in time, itis also possible to leave the pulses where they are and redefine the underlying time base. For the next experiment, I will leave everything else the same andredefine the location of the origin of time. I will place the time origin at themiddle of the boxcar pulse.

The new parameters for this experiment are shown in Figure 12 . Note that the only significant difference between Figure 12 and Figure 10 is the redefinition of the sample that represents zero time. I redefined the time origin from sample0 to sample 5. This causes the boxcar pulse to be centered on zero time. Five of the samples in the boxcar pulse occur in negative (history) time. One sample occurs exactly at zero time. The other five samples occur in positive (future) time .

Questions & Answers

differentiate between demand and supply giving examples
Lambiv Reply
differentiated between demand and supply using examples
Lambiv
what is labour ?
Lambiv
how will I do?
Venny Reply
how is the graph works?I don't fully understand
Rezat Reply
information
Eliyee
devaluation
Eliyee
t
WARKISA
hi guys good evening to all
Lambiv
multiple choice question
Aster Reply
appreciation
Eliyee
explain perfect market
Lindiwe Reply
In economics, a perfect market refers to a theoretical construct where all participants have perfect information, goods are homogenous, there are no barriers to entry or exit, and prices are determined solely by supply and demand. It's an idealized model used for analysis,
Ezea
What is ceteris paribus?
Shukri Reply
other things being equal
AI-Robot
When MP₁ becomes negative, TP start to decline. Extuples Suppose that the short-run production function of certain cut-flower firm is given by: Q=4KL-0.6K2 - 0.112 • Where is quantity of cut flower produced, I is labour input and K is fixed capital input (K-5). Determine the average product of lab
Kelo
Extuples Suppose that the short-run production function of certain cut-flower firm is given by: Q=4KL-0.6K2 - 0.112 • Where is quantity of cut flower produced, I is labour input and K is fixed capital input (K-5). Determine the average product of labour (APL) and marginal product of labour (MPL)
Kelo
yes,thank you
Shukri
Can I ask you other question?
Shukri
what is monopoly mean?
Habtamu Reply
What is different between quantity demand and demand?
Shukri Reply
Quantity demanded refers to the specific amount of a good or service that consumers are willing and able to purchase at a give price and within a specific time period. Demand, on the other hand, is a broader concept that encompasses the entire relationship between price and quantity demanded
Ezea
ok
Shukri
how do you save a country economic situation when it's falling apart
Lilia Reply
what is the difference between economic growth and development
Fiker Reply
Economic growth as an increase in the production and consumption of goods and services within an economy.but Economic development as a broader concept that encompasses not only economic growth but also social & human well being.
Shukri
production function means
Jabir
What do you think is more important to focus on when considering inequality ?
Abdisa Reply
any question about economics?
Awais Reply
sir...I just want to ask one question... Define the term contract curve? if you are free please help me to find this answer 🙏
Asui
it is a curve that we get after connecting the pareto optimal combinations of two consumers after their mutually beneficial trade offs
Awais
thank you so much 👍 sir
Asui
In economics, the contract curve refers to the set of points in an Edgeworth box diagram where both parties involved in a trade cannot be made better off without making one of them worse off. It represents the Pareto efficient allocations of goods between two individuals or entities, where neither p
Cornelius
In economics, the contract curve refers to the set of points in an Edgeworth box diagram where both parties involved in a trade cannot be made better off without making one of them worse off. It represents the Pareto efficient allocations of goods between two individuals or entities,
Cornelius
Suppose a consumer consuming two commodities X and Y has The following utility function u=X0.4 Y0.6. If the price of the X and Y are 2 and 3 respectively and income Constraint is birr 50. A,Calculate quantities of x and y which maximize utility. B,Calculate value of Lagrange multiplier. C,Calculate quantities of X and Y consumed with a given price. D,alculate optimum level of output .
Feyisa Reply
Answer
Feyisa
c
Jabir
the market for lemon has 10 potential consumers, each having an individual demand curve p=101-10Qi, where p is price in dollar's per cup and Qi is the number of cups demanded per week by the i th consumer.Find the market demand curve using algebra. Draw an individual demand curve and the market dema
Gsbwnw Reply
suppose the production function is given by ( L, K)=L¼K¾.assuming capital is fixed find APL and MPL. consider the following short run production function:Q=6L²-0.4L³ a) find the value of L that maximizes output b)find the value of L that maximizes marginal product
Abdureman
types of unemployment
Yomi Reply
What is the difference between perfect competition and monopolistic competition?
Mohammed
Got questions? Join the online conversation and get instant answers!
Jobilize.com Reply

Get Jobilize Job Search Mobile App in your pocket Now!

Get it on Google Play Download on the App Store Now


Source:  OpenStax, Digital signal processing - dsp. OpenStax CNX. Jan 06, 2016 Download for free at https://legacy.cnx.org/content/col11642/1.38
Google Play and the Google Play logo are trademarks of Google Inc.

Notification Switch

Would you like to follow the 'Digital signal processing - dsp' conversation and receive update notifications?

Ask