| << Chapter < Page | Chapter >> Page > |
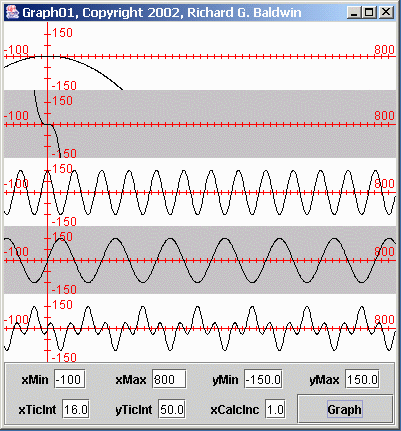
The data displayed in Figure 1 was produced by a program named Graph01Demo. A listing of that program is shown in Listing 37 near the end of the module. I will explain that program in detail shortly.
In addition, I will provide and discuss another sample program, which produces and plots data having considerably more engineering and scientificsignificance than the data shown in Figure 1 . (This will be a digital signal processing (DSP) example). Even in that case, however, you will see that the program that produces the data is much less complex than the program used toplot the data.
I will explain everything that you will need to know to cause the output from your own engineering and scientific programs to be displayed by the plottingprogram.
The graphical display of the data shown in Figure 1 was produced by my generalized plotting program named Graph01 . As you will see later, this is a long and fairly complex program.
You will find two more variations on this program in the programs named Graph03 and Graph06 in the module titled Java1482-Spectrum Analysis using Java, Sampling Frequency, Folding Frequency, and the FFT Algorithm .
A listing of the plotting program named Graph01 is shown in Listing 39 near the end of the module.
User need not understand the plotting program
Fortunately, the user of the plotting program doesn't need to understand anything about the code that makes up the plotting program. All the user needsto understand is the interface to the program, which I will explain later.
However, for those of you who may be interested, I will also discuss and explain the plotting program later in this module.
Plotting format
As you can see in Figure 1 , the plotting program allows for plotting up to five independent functions stacked vertically, each with the same vertical andhorizontal axes. This vertical stacking format makes it easy to compare up to five plots at the same points on the horizontal axes.
If you need more than five functions, the number of functions can easily be increased with a few minor changes to the program.
(I will also provide, but will not discuss, another version of the program, named Graph02 , which superimposes up to five plots on the same coordinate system. In somecases, that is a more useful form of display. You will find a complete listing of this program in Listing 40 near the end of the module.)
Plotting parameters
As you can also see in Figure 1 , a set of text fields and a button on the bottom of the frame make it possible for the user to modify the plottingparameters and to re-plot the same data with an entirely new set of plotting parameters.
(It is often true that important but subtle pieces of information can only be exposed by viewing the same data with different sets of plottingparameters.)
Same data, different parameters
Figure 2 shows the same data as in Figure 1 , but plotted with a different set of plotting parameters.
| Figure 2. Sample Display for Same Data with Different Plotting Parameters. |
|---|
 |

Notification Switch
Would you like to follow the 'Digital signal processing - dsp' conversation and receive update notifications?