Step one:
-
Compute Measures of Normality for the Dependent Variable
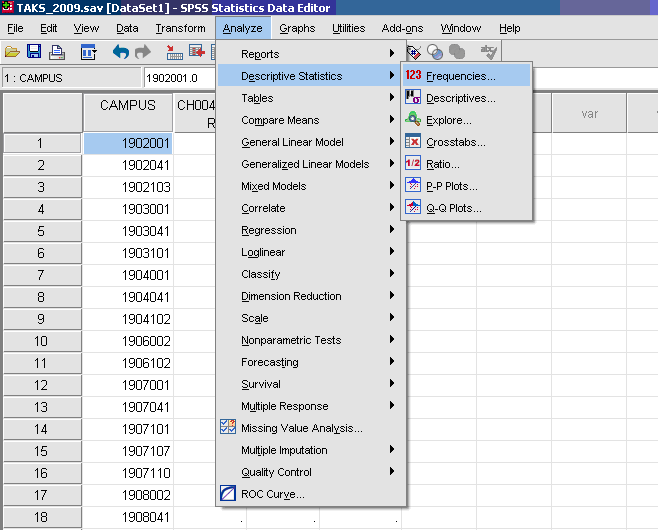
- √ Analyze
- * Descriptive Statistics
- * Frequencies
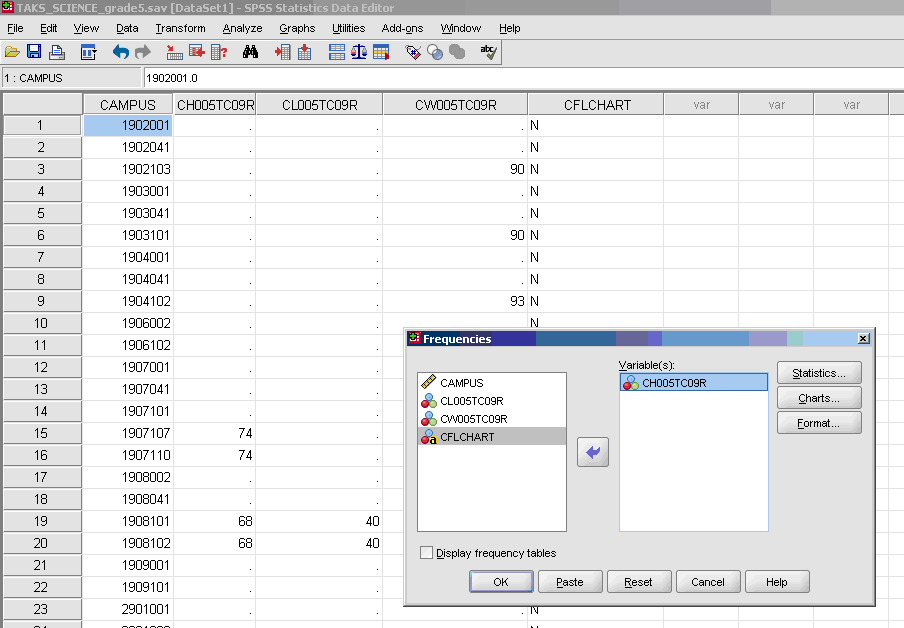
- √ Move over the dependent (outcome) variable
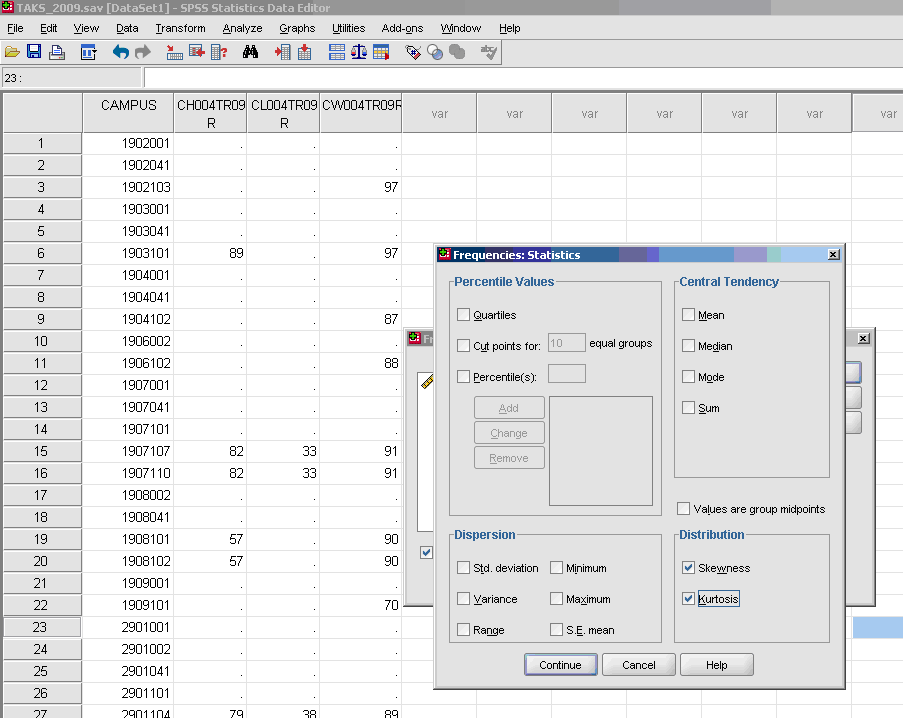
- √ Statistics
- * Skewness [Note. Skewness refers to the extent to which the data are normally distributed around the mean. Skewed data involve having either mostly high scores with a few low ones or having mostly low scores with a few high ones.] Readers are referred to the following sources for a more detailed definition of skewness: http://www.statistics.com/index.php?page=glossary&term_id=356 and http://www.statsoft.com/textbook/basic-statistics/#Descriptive%20statisticsb
- To standardize the skewness value so that its value can be constant across datasets and across studies, the following calculation must be made: Take the skewness value from the SPSS output and divide it by the Std. error of skewness. If the resulting calculation is within -3 to +3, then the skewness of the dataset is within the range of normality (Onwuegbuzie&Daniel, 2002). If the resulting calculation is outside of this +/-3 range, the dataset is not normally distributed.
- * Kurtosis [Note. Kurtosis also refers to the extent to which the data are normally distributed around the mean. This time, the data are piled up higher than normal around the mean or piled up higher than normal at the ends of the distribution.] Readers are referred to the following sources for a more detailed definition of kurtosis: http://www.statistics.com/index.php?page=glossary&term_id=326 and http://www.statsoft.com/textbook/basic-statistics/#Descriptive%20statisticsb
- To standardize the kurtosis value so that its value can be constant across datasets and across studies, the following calculation must be made: Take the kurtosis value from the SPSS output and divide it by the Std. error of kurtosis. If the resulting calculation is within -3 to +3, then the kurtosis of the dataset is within the range of normality (Onwuegbuzie&Daniel, 2002). If the resulting calculation is outside of this +/-3 range, the dataset is not normally distributed.
- * Continue
- * OK
Step two:
Check for Skewness and Kurtosis values falling within/without the parameters of normality (-3 to +3). Note that each variable below has its own skewness value and its own kurtosis value. Thus, a total of three standardized skewness coefficients and three standardized kurtosis coefficients can be calculated from information in the table below.
|
|
CH005TC09R |
CL005TC09R |
CW005TC09R |
| N |
Valid |
3125 |
1805 |
1877 |
| Missing |
5197 |
6517 |
6445 |
| Skewness |
-1.129 |
-.479 |
-2.197 |
| Std. Error of Skewness |
.044 |
.058 |
.056 |
| Kurtosis |
1.818 |
-.412 |
6.991 |
| Std. Error of Kurtosis |
.088 |
.115 |
.113 |
Skewness and Kurtosis coefficients
-
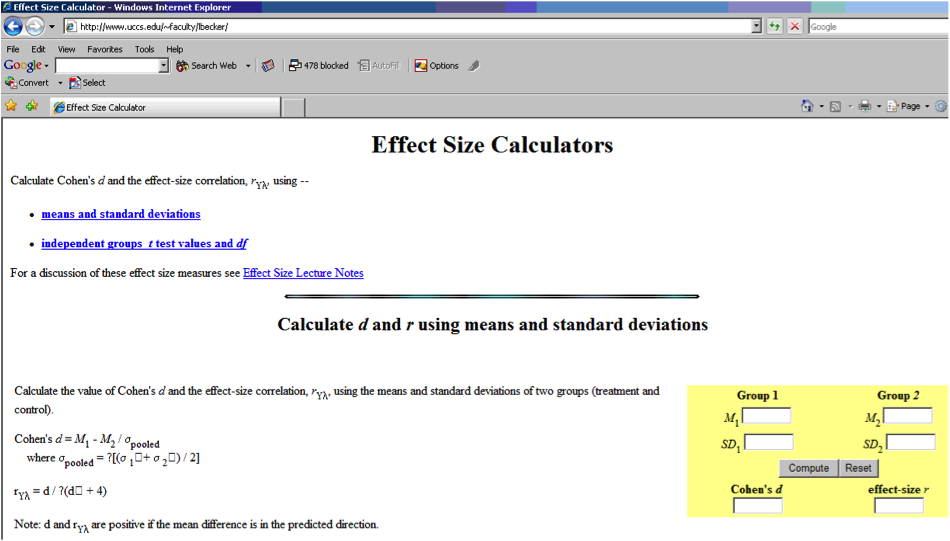
Standard Coefficients Calculator
- Copy variable #1 and #2 into the skewness and kurtosis calculator
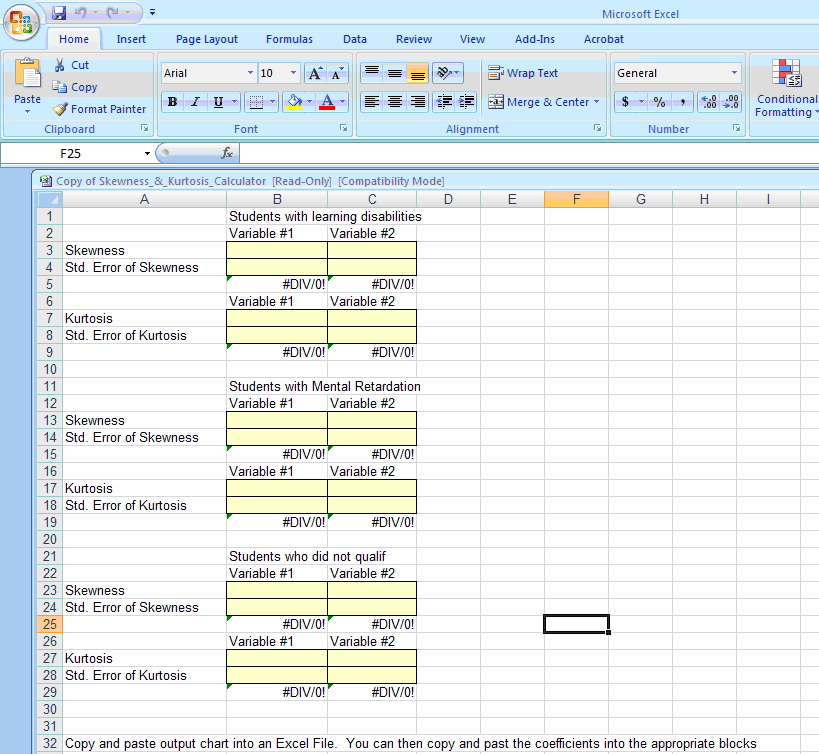
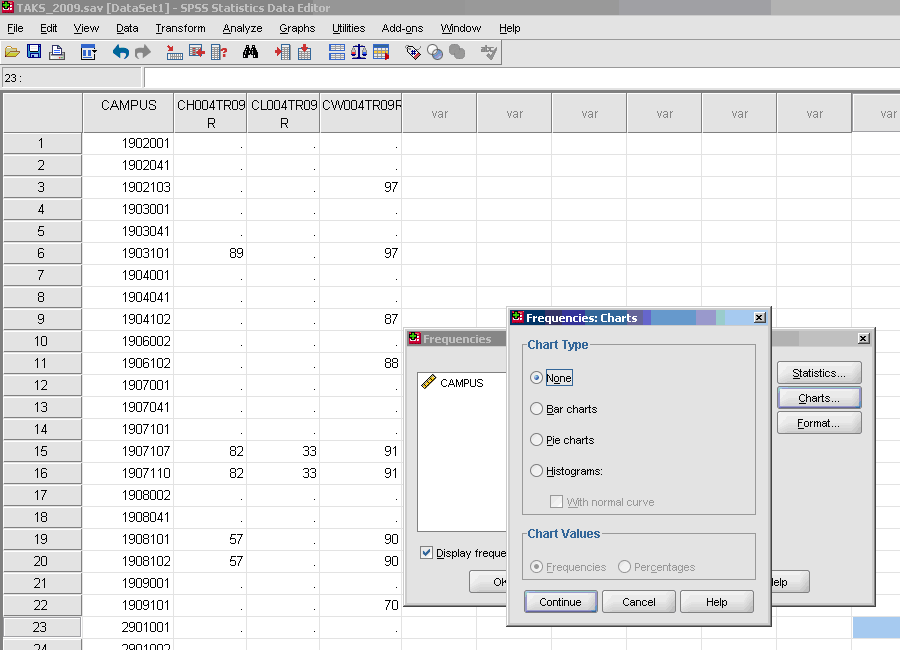
- √ Charts (these are calculated only if you wish to have visual depictions of skewness and of kurtosis-they are not required)
- * Histogram~ with normal curve (not required, optional)
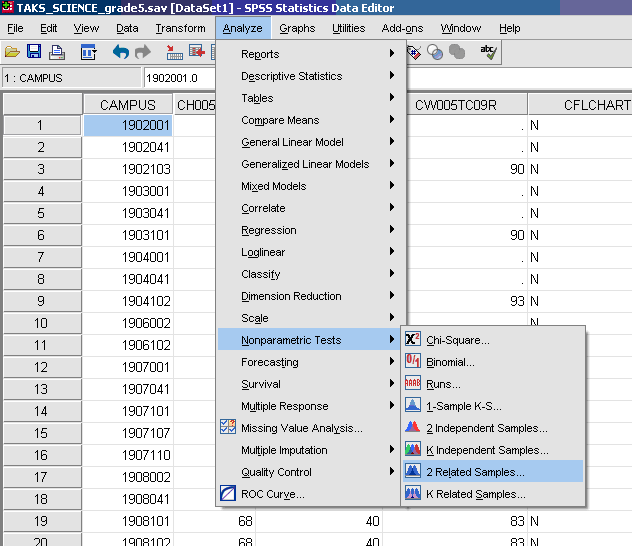
Step three:
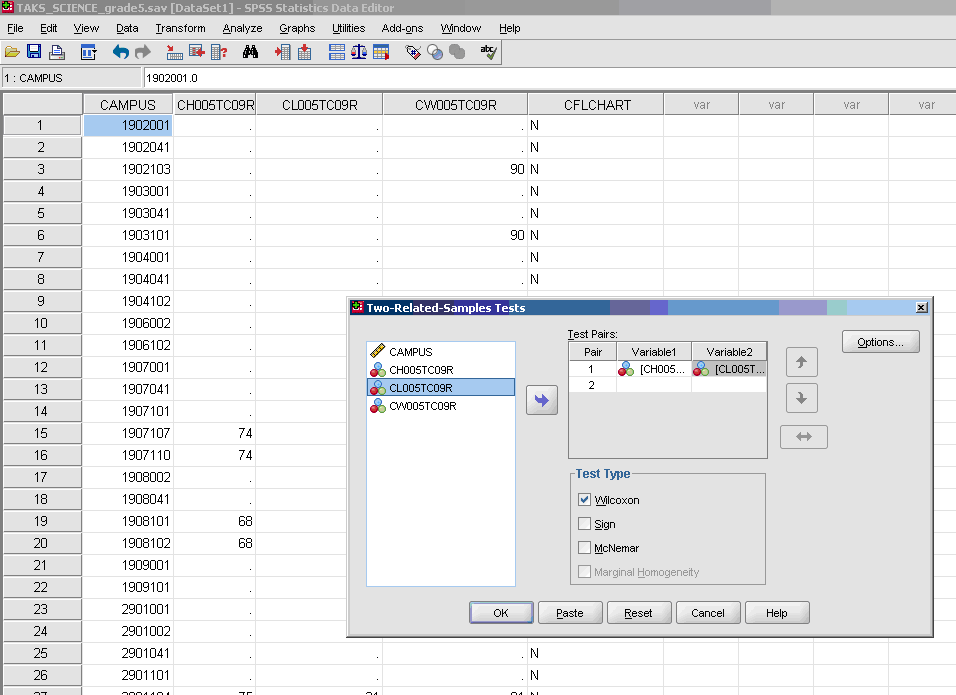
- Calculate Nonparametric Paired Samples
t -test on Data
- √ Click on one dependent variable
- * Arrow to send over to Test Pairs, Variable 1
- √ Click on second dependent variable
- * Arrow to send over to Test Pairs, Variable 2
- * OK
Step four:
-
Check for Statistical Significance
Test statistics
b
|
CL005TC09R |
|
CH005TC09R |
| Z |
-34.829
a |
| Asymp. Sig. (2-tailed) |
.000 |
- a. Based on positive ranks.
- b. Wilcoxon Signed Rank test
-
Numerical sentence is written as :
z = -34.83,
p <.001
Step five
Writing up your statistics
So, how do you "write up" your Research Questions and your Results? Schuler W. Huck (2000) in his seminal book entitled,
Reading Statistics and Research, points to the importance of your audience understanding and making sense of your research in written form. Huck further states:
This book is designed to help people
decipher what researchers are trying to communicate in the written or oral summaries of their investigations. Here, the goal is simply to distill meaning from the words, symbols, tables, and figures included in the research report. To be competent in this arena, one must not only be able to decipher what's presented but also to "fill in the holes"; this is the case because researchers typically assume that those receiving the research report are familiar with unmentioned details of the research process and statistical treatment of data.
Researchers and Professors John Slate and Ana Rojas-LeBouef understand this critical issue, so often neglected or not addressed by other authors and researchers. They point to the importance of doctoral students "writing up their statistics" in a way that others can understand your reporting and as importantly, interpret the meaning of your significant findings and implications for the preparation and practice of educational leadership. Slate and LeBouef provide you with a model for "writing up your nonparametric paired samples t-test."
Click here to view:
Writing Up Your Nonparametric Paired Samples t-test Statistics
References
- Cohen, J. (1988).
Statistical power analysis for the behavioral sciences (2nd ed.)
. Hillsdale, NJ: Lawrence Erbaum
- Hyperstats Online Statistics Textbook. (n.d.) Retrieved from
(External Link)
- Kurtosis. (n.d.). Definition. Retrieved from
(External Link)&term_id=326
- Kurtosis. (n.d.).
Definition of normality . Retrieved from
(External Link)
- Onwuegbuzie, A. J.,&Daniel, L. G. (2002). Uses and misuses of the correlation coefficient.
Research in the Schools, 9 (1)
, 73-90.
- Skewness. (n.d.) Retrieved from
(External Link)&term_id=356
- Skewness. (n.d.).
Definition of normality . Retrieved from
(External Link)
- StatSoft, Inc. (2011).
Electronic statistics textbook. Tulsa, OK: StatSoft. WEB:
(External Link)


