<< Chapter < Page Chapter >> Page >

Photoautotrophs, such as plants, algae, and photosynthetic bacteria, are the energy source for a majority of the world’s ecosystems. Photoautotrophs harness the Sun’s solar energy by converting it to chemical energy in the form of ATP (and NADP). The energy stored in ATP is used to synthesize complex organic molecules, such as glucose. The rate at which photosynthetic producers incorporate energy from the Sun is called gross primary productivity    . However, not all of the energy incorporated by producers is available to the other organisms in the food web because producers must also grow and reproduce, which consumes energy. Net primary productivity is the energy that remains in the producers after accounting for these organisms’ respiration and heat loss. The net productivity is then available to the primary consumers at the next trophic level.

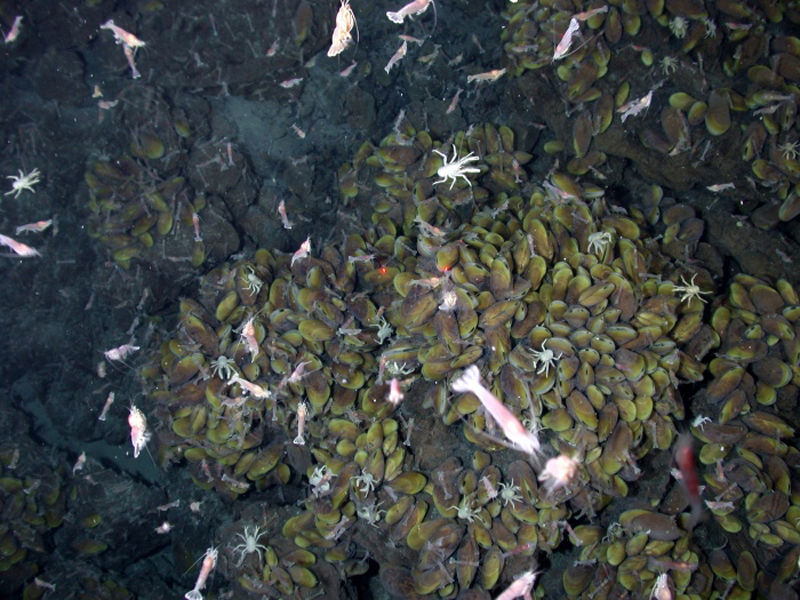
Chemoautotrophs are primarily bacteria and archaea that are found in rare ecosystems where sunlight is not available, such as those associated with dark caves or hydrothermal vents at the bottom of the ocean ( [link] ). Many chemoautotrophs in hydrothermal vents use hydrogen sulfide (H 2 S), which is released from the vents as a source of chemical energy; this allows them to synthesize complex organic molecules, such as glucose, for their own energy and, in turn, supplies energy to the rest of the ecosystem.

 Photo shows shrimp, lobster, and crabs crawling on a rocky ocean floor littered with mussels.
Swimming shrimp, a few squat lobsters, and hundreds of vent mussels are seen at a hydrothermal vent at the bottom of the ocean. As no sunlight penetrates to this depth, the ecosystem is supported by chemoautotrophic bacteria and organic material that sinks from the ocean’s surface. This picture was taken in 2006 at the submerged NW Eifuku volcano off the coast of Japan by the National Oceanic and Atmospheric Administration (NOAA). The summit of this highly active volcano lies 1535 m below the surface.

Consequences of food webs: biological magnification

One of the most important consequences of ecosystem dynamics in terms of human impact is biomagnification. Biomagnification is the increasing concentration of persistent, toxic substances in organisms at each successive trophic level. These are substances that are fat soluble, not water soluble, and are stored in the fat reserves of each organism. Many substances have been shown to biomagnify, including classical studies with the pesticide dichlorodiphenyltrichloroethane (DDT), which were described in the 1960s bestseller, Silent Spring by Rachel Carson. DDT was a commonly used pesticide before its dangers to apex consumers, such as the bald eagle, became known. In aquatic ecosystems, organisms from each trophic level consumed many organisms in the lower level, which caused DDT to increase in birds (apex consumers) that ate fish. Thus, the birds accumulated sufficient amounts of DDT to cause fragility in their eggshells. This effect increased egg breakage during nesting and was shown to have devastating effects on these bird populations. The use of DDT was banned in the United States in the 1970s.

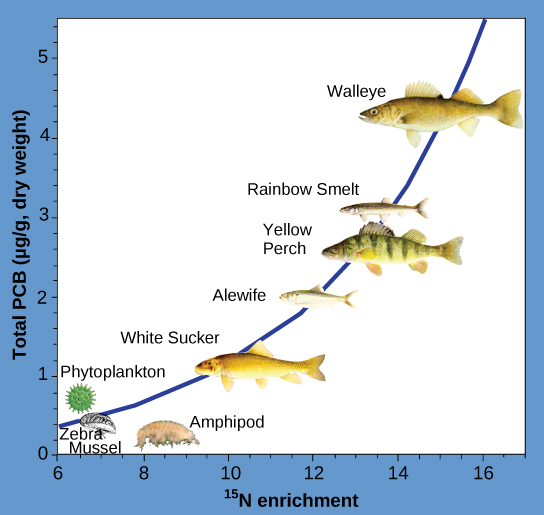
Other substances that biomagnify are polychlorinated biphenyls (PCB), which were used as coolant liquids in the United States until their use was banned in 1979, and heavy metals, such as mercury, lead, and cadmium. These substances are best studied in aquatic ecosystems, where predatory fish species accumulate very high concentrations of toxic substances that are at quite low concentrations in the environment and in producers. As illustrated in a study performed by the NOAA in the Saginaw Bay of Lake Huron of the North American Great Lakes ( [link] ), PCB concentrations increased from the producers of the ecosystem (phytoplankton) through the different trophic levels of fish species. The apex consumer, the walleye, has more than four times the amount of PCBs compared to phytoplankton. Also, based on results from other studies, birds that eat these fish may have PCB levels at least one order of magnitude higher than those found in the lake fish.

 The illustration is a graph that plots total PCBs in micrograms per gram of dry weight versus nitrogen-15 enrichment, shows that PCBs become increasingly concentrated at higher trophic levels. The slope of the graph becomes increasingly steep as consumer levels increase, from phytoplankton to walleye.
This chart shows the PCB concentrations found at the various trophic levels in the Saginaw Bay ecosystem of Lake Huron. Notice that the fish in the higher trophic levels accumulate more PCBs than those in lower trophic levels. (credit: Patricia Van Hoof, NOAA)

Other concerns have been raised by the biomagnification of heavy metals, such as mercury and cadmium, in certain types of seafood. The United States Environmental Protection Agency recommends that pregnant women and young children should not consume any swordfish, shark, king mackerel, or tilefish because of their high mercury content. These individuals are advised to eat fish low in mercury: salmon, shrimp, pollock, and catfish. Biomagnification is a good example of how ecosystem dynamics can affect our everyday lives, even influencing the food we eat.

Section summary

Ecosystems exist underground, on land, at sea, and in the air. Organisms in an ecosystem acquire energy in a variety of ways, which is transferred between trophic levels as the energy flows from the base to the top of the food web, with energy being lost at each transfer. There is energy lost at each trophic level, so the lengths of food chains are limited because there is a point where not enough energy remains to support a population of consumers. Fat soluble compounds biomagnify up a food chain causing damage to top consumers. even when environmental concentrations of a toxin are low.

Questions & Answers

differentiate between demand and supply giving examples
Lambiv Reply
differentiated between demand and supply using examples
Lambiv
what is labour ?
Lambiv
how will I do?
Venny Reply
how is the graph works?I don't fully understand
Rezat Reply
information
Eliyee
devaluation
Eliyee
t
WARKISA
hi guys good evening to all
Lambiv
multiple choice question
Aster Reply
appreciation
Eliyee
explain perfect market
Lindiwe Reply
In economics, a perfect market refers to a theoretical construct where all participants have perfect information, goods are homogenous, there are no barriers to entry or exit, and prices are determined solely by supply and demand. It's an idealized model used for analysis,
Ezea
What is ceteris paribus?
Shukri Reply
other things being equal
AI-Robot
When MP₁ becomes negative, TP start to decline. Extuples Suppose that the short-run production function of certain cut-flower firm is given by: Q=4KL-0.6K2 - 0.112 • Where is quantity of cut flower produced, I is labour input and K is fixed capital input (K-5). Determine the average product of lab
Kelo
Extuples Suppose that the short-run production function of certain cut-flower firm is given by: Q=4KL-0.6K2 - 0.112 • Where is quantity of cut flower produced, I is labour input and K is fixed capital input (K-5). Determine the average product of labour (APL) and marginal product of labour (MPL)
Kelo
yes,thank you
Shukri
Can I ask you other question?
Shukri
what is monopoly mean?
Habtamu Reply
What is different between quantity demand and demand?
Shukri Reply
Quantity demanded refers to the specific amount of a good or service that consumers are willing and able to purchase at a give price and within a specific time period. Demand, on the other hand, is a broader concept that encompasses the entire relationship between price and quantity demanded
Ezea
ok
Shukri
how do you save a country economic situation when it's falling apart
Lilia Reply
what is the difference between economic growth and development
Fiker Reply
Economic growth as an increase in the production and consumption of goods and services within an economy.but Economic development as a broader concept that encompasses not only economic growth but also social & human well being.
Shukri
production function means
Jabir
What do you think is more important to focus on when considering inequality ?
Abdisa Reply
any question about economics?
Awais Reply
sir...I just want to ask one question... Define the term contract curve? if you are free please help me to find this answer 🙏
Asui
it is a curve that we get after connecting the pareto optimal combinations of two consumers after their mutually beneficial trade offs
Awais
thank you so much 👍 sir
Asui
In economics, the contract curve refers to the set of points in an Edgeworth box diagram where both parties involved in a trade cannot be made better off without making one of them worse off. It represents the Pareto efficient allocations of goods between two individuals or entities, where neither p
Cornelius
In economics, the contract curve refers to the set of points in an Edgeworth box diagram where both parties involved in a trade cannot be made better off without making one of them worse off. It represents the Pareto efficient allocations of goods between two individuals or entities,
Cornelius
Suppose a consumer consuming two commodities X and Y has The following utility function u=X0.4 Y0.6. If the price of the X and Y are 2 and 3 respectively and income Constraint is birr 50. A,Calculate quantities of x and y which maximize utility. B,Calculate value of Lagrange multiplier. C,Calculate quantities of X and Y consumed with a given price. D,alculate optimum level of output .
Feyisa Reply
Answer
Feyisa
c
Jabir
the market for lemon has 10 potential consumers, each having an individual demand curve p=101-10Qi, where p is price in dollar's per cup and Qi is the number of cups demanded per week by the i th consumer.Find the market demand curve using algebra. Draw an individual demand curve and the market dema
Gsbwnw Reply
suppose the production function is given by ( L, K)=L¼K¾.assuming capital is fixed find APL and MPL. consider the following short run production function:Q=6L²-0.4L³ a) find the value of L that maximizes output b)find the value of L that maximizes marginal product
Abdureman
types of unemployment
Yomi Reply
What is the difference between perfect competition and monopolistic competition?
Mohammed
Got questions? Join the online conversation and get instant answers!
Jobilize.com Reply

Get Jobilize Job Search Mobile App in your pocket Now!

Get it on Google Play Download on the App Store Now


Source:  OpenStax, Environmental biology. OpenStax CNX. Aug 10, 2015 Download for free at https://legacy.cnx.org/content/col11863/1.1
Google Play and the Google Play logo are trademarks of Google Inc.

Notification Switch

Would you like to follow the 'Environmental biology' conversation and receive update notifications?

Ask