

| << Chapter < Page | Chapter >> Page > |
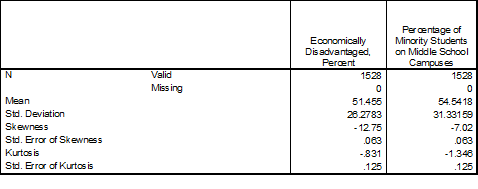
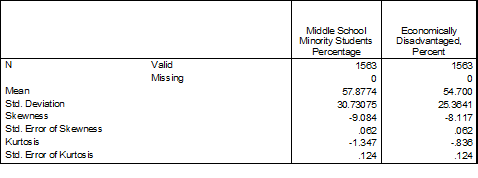
Concerning the standardized skewness coefficients for the percent of minority student enrollment, all three coefficients were outside of the limits of normality, -111.43, -162.24, and -130.92 for the 2003-2004, 2004-2005, and 2005-2006 school years respectively. The standardized kurtosis coefficients for minority student enrollment were -10.77, -10.92, and -6.74 for each of the three years respectively. Therefore, all six standardized skewness coefficients and all 6 standardized kurtosis coefficients were outside of the limits of normality, +/- 3, and were indicative of serious departures from normality (Onwuegbuzie&Daniel, 2002). Accordingly, a nonparametric procedure, the Spearman’s rank order correlation coefficient (i.e., Spearman's rho) was performed to address each research question previously delineated.
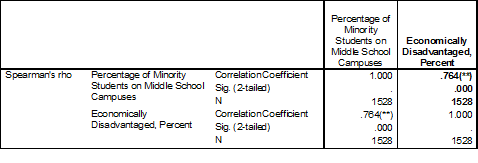
The Spearman’s rho revealed a statistically significant relationship between the percent of economically disadvantaged students and the percent of minority students enrolled in Texas middle schools during the 2003-2004 school year ( r s [1528] = .76, p <.001). The effect size of this relationship was large (Cohen, 1988). Squaring the correlation coefficients indicated that 58.4% of the variance in the percent of economically disadvantaged students was explained by the presence of minority students. Similarly, 58.4% of the variance in the percent of minority student enrollment was accounted for by the presence of economically disadvantaged students.
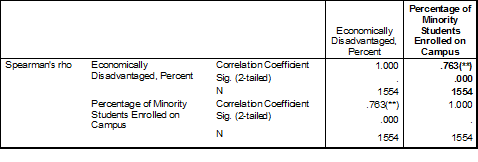
For the 2004-2005 school year, the Spearman’s rho revealed a statistically significant relationship between the percent of economically disadvantaged students and the percent of minority students enrolled in Texas middle schools, ( r s [1554] = .76, p <.001). The effect size of this relationship was large (Cohen, 1988). Squaring the correlation coefficients indicated that 58.2% of the variance in the percent of economically disadvantaged students was explained by the presence of minority students. Similarly, 58.2% of the variance in the percent of minority student enrollment was accounted for by the percent of economically disadvantaged students.
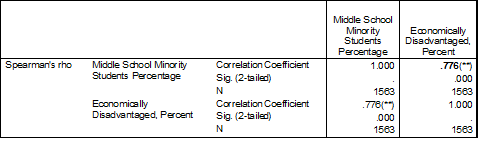
The Spearman’s rho revealed a statistically significant relationship between the percent of economically disadvantaged students and the percent of minority students enrolled in Texas middle schools during the 2005-2006 school year ( r s [1563] = .78, p <.001). The effect size of this relationship was large (Cohen, 1988). Squaring the correlation coefficients indicated that 60.2% of the variance in the percent of economically disadvantaged students was explained by the presence of minority students. Similarly, 60.2% of the variance in the percent of minority student enrollment was explained by the presence of economically disadvantaged students.
In summary, results across the three years of data were consistent. Effect sizes for all three years were large (Cohen, 1988). Moreover, the percent of variance explained by each variable was consistent, ranging from 58.4% to 60.2%. Thus, findings revealed herein were supportive of a consistent relationship between the percent of economically disadvantaged students and the percent of minority students enrolled in Texas middle schools.
| Year and Variable | n | M | SD |
| 2003-2004 School Year | |||
| Economically Disadvantaged | 1,528 | 51.46 | 26.28 |
| Minority Students | 1,528 | 54.54 | 31.33 |
| 2004-2005 School Year | |||
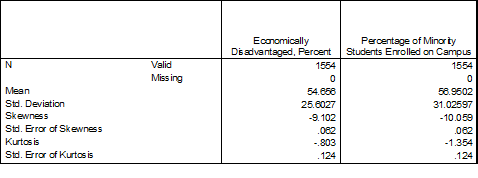
| Economically Disadvantaged | 1,554 | 54.66 | 25.60 |
| Minority Students | 1,554 | 56.95 | 31.03 |
| 2005-2006 School Year | |||
| Economically Disadvantaged | 1,563 | 54.70 | 25.36 |
| Minority Students | 1,563 | 57.88 | 30.73 |
Notification Switch
Would you like to follow the 'Presenting and communicating your statistical findings: model writeups' conversation and receive update notifications?

|
|

|
|

|
|

|
|

|
|

|
|

|
|

|
|

|
|

|