<< Chapter < Page Chapter >> Page >

In some cases, lawmakers make investments in physical capital as a way of spending money in the districts of key politicians. The result may be unnecessary roads or office buildings. Even if a project is useful and necessary, it might be done in a way that is excessively costly, because local contractors who make campaign contributions to politicians appreciate the extra business. On the other hand, governments sometimes do not make the investments they should because a decision to spend on infrastructure does not need to just make economic sense; it must be politically popular as well. Managing public investment so that it is done in a cost-effective way can be difficult.

If a government decides to finance an investment in public physical capital with higher taxes or lower government spending in other areas, it need not worry that it is directly crowding out private investment. Indirectly however, higher household taxes could cut down on the level of private savings available and have a similar effect. If a government decides to finance an investment in public physical capital by borrowing, it may end up increasing the quantity of public physical capital at the cost of crowding out investment in private physical capital, which is more beneficial to the economy would be dependent on the project being considered.

Public investment in human capital

In most countries, the government plays a large role in society's investment in human capital through the education system. A highly educated and skilled workforce contributes to a higher rate of economic growth. For the low-income nations of the world, additional investment in human capital seems likely to increase productivity and growth. For the United States, tough questions have been raised about how much increases in government spending on education will improve the actual level of education.

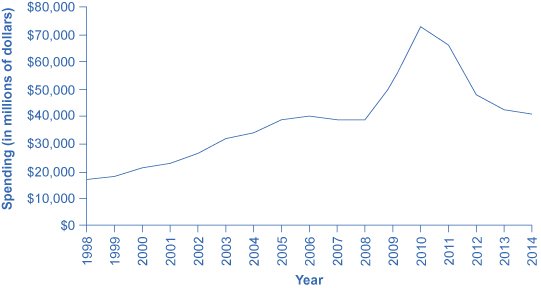
Among economists, discussions of education reform often begin with some uncomfortable facts. As shown in [link] , spending per student for kindergarten through grade 12 (K–12) increased substantially in real dollars through 2010. The U.S. Census Bureau reports that current spending per pupil for elementary and secondary education rose from $5,001 in 1998 to $10,608 in 2012. However, as measured by standardized tests like the SAT, the level of student academic achievement has barely budged in recent decades. Indeed, on international tests, U.S. students lag behind students from many other countries. (Of course, test scores are an imperfect measure of education for a variety of reasons. It would be difficult, however, to argue that there are not real problems in the U.S. education system and that the tests are just inaccurate.)

Total spending for elementary, secondary, and vocational education (1998–2014) in the united states

The line graph shows that government spending on education has continually increased from 1998 up until 2006, where it leveled off. In 2008, it increased dramatically from $35 to over $70 million. Since 2010, spending has steadily decreased to a little over $40 million in 2014.
The graph shows that government spending on education was continually increasing up until 2006 where it leveled off until 2008 when it increased dramatically. Since 2010, spending has steadily decreased. (Source: Office of Management and Budget)

Questions & Answers

differentiate between demand and supply giving examples
Lambiv Reply
differentiated between demand and supply using examples
Lambiv
what is labour ?
Lambiv
how will I do?
Venny Reply
how is the graph works?I don't fully understand
Rezat Reply
information
Eliyee
devaluation
Eliyee
t
WARKISA
hi guys good evening to all
Lambiv
multiple choice question
Aster Reply
appreciation
Eliyee
explain perfect market
Lindiwe Reply
In economics, a perfect market refers to a theoretical construct where all participants have perfect information, goods are homogenous, there are no barriers to entry or exit, and prices are determined solely by supply and demand. It's an idealized model used for analysis,
Ezea
What is ceteris paribus?
Shukri Reply
other things being equal
AI-Robot
When MP₁ becomes negative, TP start to decline. Extuples Suppose that the short-run production function of certain cut-flower firm is given by: Q=4KL-0.6K2 - 0.112 • Where is quantity of cut flower produced, I is labour input and K is fixed capital input (K-5). Determine the average product of lab
Kelo
Extuples Suppose that the short-run production function of certain cut-flower firm is given by: Q=4KL-0.6K2 - 0.112 • Where is quantity of cut flower produced, I is labour input and K is fixed capital input (K-5). Determine the average product of labour (APL) and marginal product of labour (MPL)
Kelo
yes,thank you
Shukri
Can I ask you other question?
Shukri
what is monopoly mean?
Habtamu Reply
What is different between quantity demand and demand?
Shukri Reply
Quantity demanded refers to the specific amount of a good or service that consumers are willing and able to purchase at a give price and within a specific time period. Demand, on the other hand, is a broader concept that encompasses the entire relationship between price and quantity demanded
Ezea
ok
Shukri
how do you save a country economic situation when it's falling apart
Lilia Reply
what is the difference between economic growth and development
Fiker Reply
Economic growth as an increase in the production and consumption of goods and services within an economy.but Economic development as a broader concept that encompasses not only economic growth but also social & human well being.
Shukri
production function means
Jabir
What do you think is more important to focus on when considering inequality ?
Abdisa Reply
any question about economics?
Awais Reply
sir...I just want to ask one question... Define the term contract curve? if you are free please help me to find this answer 🙏
Asui
it is a curve that we get after connecting the pareto optimal combinations of two consumers after their mutually beneficial trade offs
Awais
thank you so much 👍 sir
Asui
In economics, the contract curve refers to the set of points in an Edgeworth box diagram where both parties involved in a trade cannot be made better off without making one of them worse off. It represents the Pareto efficient allocations of goods between two individuals or entities, where neither p
Cornelius
In economics, the contract curve refers to the set of points in an Edgeworth box diagram where both parties involved in a trade cannot be made better off without making one of them worse off. It represents the Pareto efficient allocations of goods between two individuals or entities,
Cornelius
Suppose a consumer consuming two commodities X and Y has The following utility function u=X0.4 Y0.6. If the price of the X and Y are 2 and 3 respectively and income Constraint is birr 50. A,Calculate quantities of x and y which maximize utility. B,Calculate value of Lagrange multiplier. C,Calculate quantities of X and Y consumed with a given price. D,alculate optimum level of output .
Feyisa Reply
Answer
Feyisa
c
Jabir
the market for lemon has 10 potential consumers, each having an individual demand curve p=101-10Qi, where p is price in dollar's per cup and Qi is the number of cups demanded per week by the i th consumer.Find the market demand curve using algebra. Draw an individual demand curve and the market dema
Gsbwnw Reply
suppose the production function is given by ( L, K)=L¼K¾.assuming capital is fixed find APL and MPL. consider the following short run production function:Q=6L²-0.4L³ a) find the value of L that maximizes output b)find the value of L that maximizes marginal product
Abdureman
types of unemployment
Yomi Reply
What is the difference between perfect competition and monopolistic competition?
Mohammed
Got questions? Join the online conversation and get instant answers!
Jobilize.com Reply

Get Jobilize Job Search Mobile App in your pocket Now!

Get it on Google Play Download on the App Store Now


Source:  OpenStax, Principles of macroeconomics for ap® courses. OpenStax CNX. Aug 24, 2015 Download for free at http://legacy.cnx.org/content/col11864/1.2
Google Play and the Google Play logo are trademarks of Google Inc.

Notification Switch

Would you like to follow the 'Principles of macroeconomics for ap® courses' conversation and receive update notifications?

Ask