

| << Chapter < Page | Chapter >> Page > |
Why did the budget deficits suddenly turn to surpluses from 1998 to 2001? And why did the surpluses return to deficits in 2002? Why did the deficit become so large after 2007? [link] suggests some answers. The graph combines the earlier information on total federal spending and taxes in a single graph, but focuses on the federal budget since 1990.
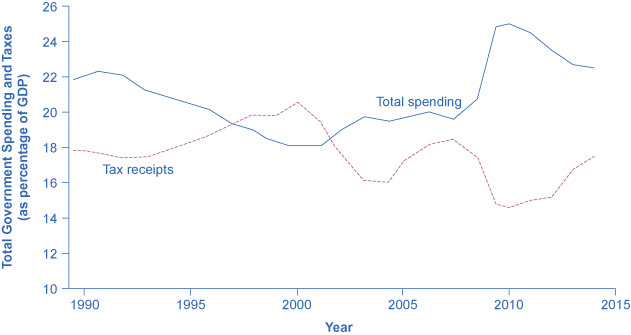
Government spending as a share of GDP declined steadily through the 1990s. The biggest single reason was that defense spending declined from 5.2% of GDP in 1990 to 3.0% in 2000, but interest payments by the federal government also fell by about 1.0% of GDP. However, federal tax collections increased substantially in the later 1990s, jumping from 18.1% of GDP in 1994 to 20.8% in 2000. Powerful economic growth in the late 1990s fueled the boom in taxes. Personal income taxes rise as income goes up; payroll taxes rise as jobs and payrolls go up; corporate income taxes rise as profits go up. At the same time, government spending on transfer payments such as unemployment benefits, foods stamps, and welfare declined with more people working.
This sharp increase in tax revenues and decrease in expenditures on transfer payments was largely unexpected even by experienced budget analysts, and so budget surpluses came as a surprise. But in the early 2000s, many of these factors started running in reverse. Tax revenues sagged, due largely to the recession that started in March 2001, which reduced revenues. A series of tax cuts was enacted by Congress and signed into law by President George W. Bush, starting in 2001. In addition, government spending swelled due to increases in defense, healthcare, education, Social Security, and support programs for those who were hurt by the recession and the slow growth that followed. Deficits returned. When the severe recession hit in late 2007, spending climbed and tax collections fell to historically unusual levels, resulting in enormous deficits.
Longer-term forecasts of the U.S. budget, a decade or more into the future, predict enormous deficits. The higher deficits run during the recession of 2008–2009 have repercussions, and the demographics will be challenging. The primary reason is the “baby boom”—the exceptionally high birthrates that began in 1946, right after World War II, and lasted for about two decades. Starting in 2010, the front edge of the baby boom generation began to reach age 65, and in the next two decades, the proportion of Americans over the age of 65 will increase substantially. The current level of the payroll taxes that support Social Security and Medicare will fall well short of the projected expenses of these programs, as the following Clear It Up feature shows; thus, the forecast is for large budget deficits. A decision to collect more revenue to support these programs or to decrease benefit levels would alter this long-term forecast.
In 1946, just one American in 13 was over age 65. By 2000, it was one in eight. By 2030, one American in five will be over age 65. Two enormous U.S. federal programs focus on the elderly—Social Security and Medicare. The growing numbers of elderly Americans will increase spending on these programs, as well as on Medicaid. The current payroll tax levied on workers, which supports all of Social Security and the hospitalization insurance part of Medicare, will not be enough to cover the expected costs. So, what are the options?
Long-term projections from the Congressional Budget Office in 2009 are that Medicare and Social Security spending combined will rise from 8.3% of GDP in 2009 to about 13% by 2035 and about 20% in 2080. If this rise in spending occurs, without any corresponding rise in tax collections, then some mix of changes must occur: (1) taxes will need to be increased dramatically; (2) other spending will need to be cut dramatically; (3) the retirement age and/or age receiving Medicare benefits will need to increase, or (4) the federal government will need to run extremely large budget deficits.
Some proposals suggest removing the cap on wages subject to the payroll tax, so that those with very high incomes would have to pay the tax on the entire amount of their wages. Other proposals suggest moving Social Security and Medicare from systems in which workers pay for retirees toward programs that set up accounts where workers save funds over their lifetimes and then draw out after retirement to pay for healthcare.
The United States is not alone in this problem. Indeed, providing the promised level of retirement and health benefits to a growing proportion of elderly with a falling proportion of workers is an even more severe problem in many European nations and in Japan. How to pay promised levels of benefits to the elderly will be a difficult public policy decision.
In the next module we shift to the use of fiscal policy to counteract business cycle fluctuations. In addition, we will explore proposals requiring a balanced budget—that is, for government spending and taxes to be equal each year. The Impacts of Government Borrowing will also cover how fiscal policy and government borrowing will affect national saving—and thus affect economic growth and trade imbalances.
For most of the twentieth century, the U.S. government took on debt during wartime and then paid down that debt slowly in peacetime. However, it took on quite substantial debts in peacetime in the 1980s and early 1990s, before a brief period of budget surpluses from 1998 to 2001, followed by a return to annual budget deficits since 2002, with very large deficits in the recession of 2008 and 2009. A budget deficit or budget surplus is measured annually. Total government debt or national debt is the sum of budget deficits and budget surpluses over time.
If a government runs a budget deficit of $10 billion dollars each year for ten years, then a surplus of $1 billion for five years, and then a balanced budget for another ten years, what is the government debt?
Eisner, Robert. The Great Deficit Scares: The Federal Budget, Trade, and Social Security . New York: Priority Press Publications, 1997.
Weisman, Jonathan, and Ashley Parker. “Republicans Back Down, Ending Crisis Over Shutdown and Debt Limit.” The New York Times , October 16, 2013. http://www.nytimes.com/2013/10/17/us/congress-budget-debate.html.
Wessel, David. Red Ink: Inside the High-Stakes Politics of Federal Budget . New York: Crown Publishing Group, 2013.
Notification Switch
Would you like to follow the 'Principles of macroeconomics for ap® courses' conversation and receive update notifications?

|
|
|
|
|

|
|

|
|

|
|

|
|

|
|

|
|
|
|
|
|
|
|

|
|

|