<< Chapter < Page Chapter >> Page >
Learn how to display column matrices in a graphical format to make it easier to visualize them.

Table of contents

Preface

This module is one in a collection of modules designed for teaching GAME2302 Mathematical Applications for Game Development at Austin Community College in Austin, TX.

What you have learned

In the previous module, you learned:

  • How to compare column matrices for equality
  • How to compare two points for equality
  • How to compare two vectors for equality
  • How to add one column matrix to another
  • How to subtract one column matrix from another
  • How to get a displacement vector from one point to another.

What you will learn

In this module, you will learn how to display column matrices in a graphical format. This may help you to get a better grasp of the nature of column matricesand the results of adding, subtracting, and comparing them.

Viewing tip

I recommend that you open another copy of this module in a separate browser window and use the following links to easily find and view the Figuresand Listings while you are reading about them.

Figures

  • Figure 1 . Sample graphical program output.
  • Figure 2 . Text output from the program.
  • Figure 3 . Graphical output for equal vectors.
  • Figure 4 . Text output for equal vectors.
  • Figure 5 . Graphic output from Exercise 01.

Listings

  • Listing 1 . Beginning of the method named displayColumnMatrices.
  • Listing 2 . Use the slider values to create the two matrices.
  • Listing 3 . Add and subtract the matrices.
  • Listing 4 . Display text information about the matrices.
  • Listing 5 . Create mathematical points.
  • Listing 6 . Create mathematical displacement vectors.
  • Listing 7 . Produce a graphical representation of the displacement vectors.
  • Listing 8 . Source code for the program named ColMatrixVis01.

Preview

Abstract mathematical concepts are often easier to grasp if you can visualize them in graphical format. For example, the nature of the followingequation often becomes more apparent once you learn that it is the equation of a straight line.

y = m*x + b

Similarly, the nature of the following equation often becomes more apparent once you learn that it is the equation of a parabola and you learn the generalshape of a parabola.

y = x^2 + k

where x^2 indicates x raised to the second power.

As mentioned earlier, in this module, you will learn how to display column matrices in a graphical format. This may help you to get a better grasp of the nature of column matricesand the results of adding, subtracting, and comparing them.

I will present and explain an interactive program that behaves as follows:

Two column matrices are created using values obtained from the sliders shown at the bottom of Figure 1 . One matrix is named redMatrix and the other matrix is named greenMatrix .

Figure 1 Sample graphical program output.

Missing image.

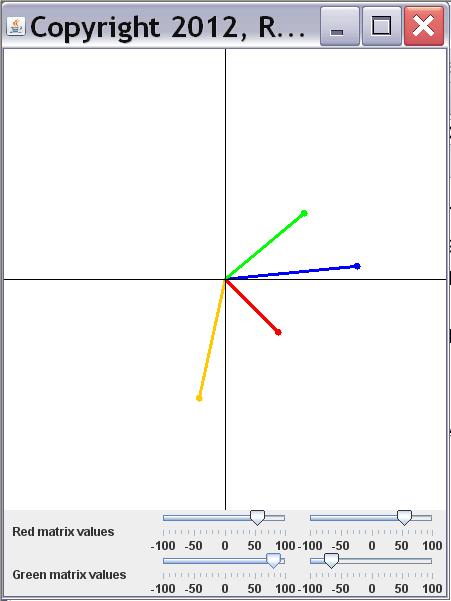
Two additional column matrices are created by adding and subtracting the original matrices.The matrix created by adding the red and green matrices is named blueMatrix . The matrix created by subtracting the green matrix from the red matrix is named orangeMatrix .

Questions & Answers

how to study physic and understand
Ewa Reply
what is conservative force with examples
Moses
what is work
Fredrick Reply
the transfer of energy by a force that causes an object to be displaced; the product of the component of the force in the direction of the displacement and the magnitude of the displacement
AI-Robot
why is it from light to gravity
Esther Reply
difference between model and theory
Esther
Is the ship moving at a constant velocity?
Kamogelo Reply
The full note of modern physics
aluet Reply
introduction to applications of nuclear physics
aluet Reply
the explanation is not in full details
Moses Reply
I need more explanation or all about kinematics
Moses
yes
zephaniah
I need more explanation or all about nuclear physics
aluet
Show that the equal masses particles emarge from collision at right angle by making explicit used of fact that momentum is a vector quantity
Muhammad Reply
yh
Isaac
A wave is described by the function D(x,t)=(1.6cm) sin[(1.2cm^-1(x+6.8cm/st] what are:a.Amplitude b. wavelength c. wave number d. frequency e. period f. velocity of speed.
Majok Reply
what is frontier of physics
Somto Reply
A body is projected upward at an angle 45° 18minutes with the horizontal with an initial speed of 40km per second. In hoe many seconds will the body reach the ground then how far from the point of projection will it strike. At what angle will the horizontal will strike
Gufraan Reply
Suppose hydrogen and oxygen are diffusing through air. A small amount of each is released simultaneously. How much time passes before the hydrogen is 1.00 s ahead of the oxygen? Such differences in arrival times are used as an analytical tool in gas chromatography.
Ezekiel Reply
please explain
Samuel
what's the definition of physics
Mobolaji Reply
what is physics
Nangun Reply
the science concerned with describing the interactions of energy, matter, space, and time; it is especially interested in what fundamental mechanisms underlie every phenomenon
AI-Robot
what is isotopes
Nangun Reply
nuclei having the same Z and different N s
AI-Robot
Got questions? Join the online conversation and get instant answers!
Jobilize.com Reply

Get Jobilize Job Search Mobile App in your pocket Now!

Get it on Google Play Download on the App Store Now


Source:  OpenStax, Game 2302 - mathematical applications for game development. OpenStax CNX. Jan 09, 2016 Download for free at https://legacy.cnx.org/content/col11450/1.33
Google Play and the Google Play logo are trademarks of Google Inc.

Notification Switch

Would you like to follow the 'Game 2302 - mathematical applications for game development' conversation and receive update notifications?

Ask