| << Chapter < Page | Chapter >> Page > |
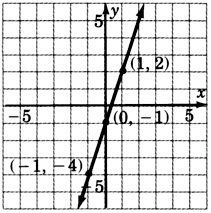
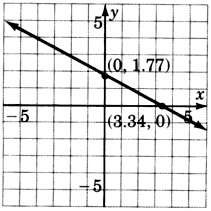
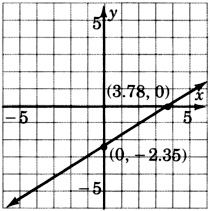
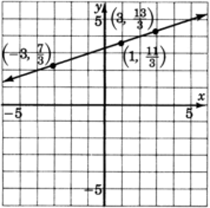
The graphs we have constructed so far have been done by finding two particular points, the intercepts. Actually, any two points will do. We chose to use the intercepts because they are usually the easiest to work with. In the next example, we will graph two equations using points other than the intercepts. We’ll use three points, the extra point serving as a check.
.
We can find three points by choosing three
and computing to find the corresponding
. We’ll put our results in a table for ease of reading.
Since we are going to choose and then compute to find the corresponding , it will be to our advantage to solve the given equation for .
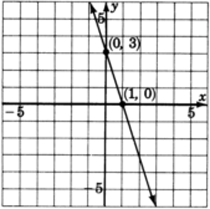
| 1 | If , then | |
| If , then | ||
| 3 | If , then |
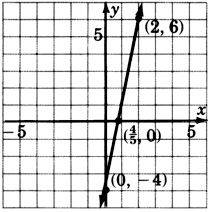
Thus, we have the three ordered pairs (points), , , . If we wish, we can change the improper fractions to mixed numbers, , , .
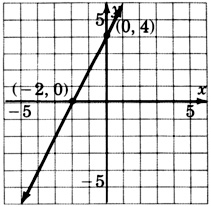
We solve for .
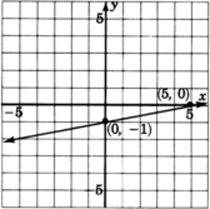
| 0 | 0 | |
| 2 | ||
| 3 |
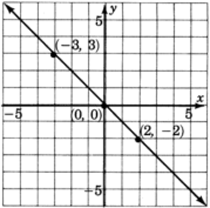
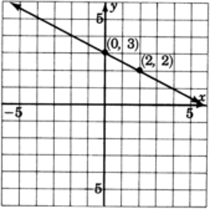
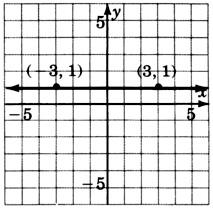
Notice that the and are the same point. Thus the intercept method does not provide enough information to construct this graph.
When an equation is given in the general form , usually the most efficient approach to constructing the graph is to use the intercept method, when it works.
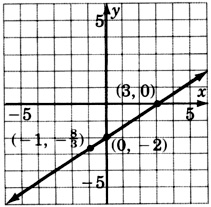
Graph the following equations.
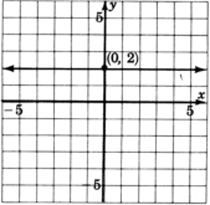
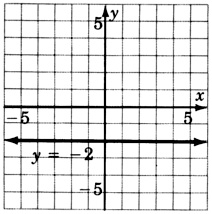
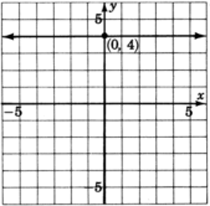
In all the graphs we have observed so far, the lines have been slanted. This will always be the case when both variables appear in the equation. If only one variable appears in the equation, then the line will be either vertical or horizontal. To see why, let’s consider a specific case:
Using the general form of a line, , we can produce an equation with exactly one variable by choosing , , and . The equation then becomes
Since , the term is for any number that is chosen for .
Thus,
becomes
But, is the additive identity and .
Then, solving for we get
This is an equation in which exactly one variable appears.
This means that regardless of which number we choose for , the corresponding is 3. Since the is always the same as we move from left-to-right through the , the height of the line above the is always the same (in this case, 3 units). This type of line must be horizontal.
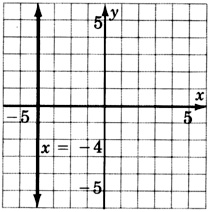
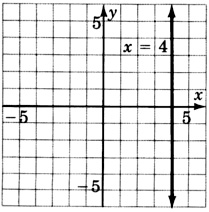
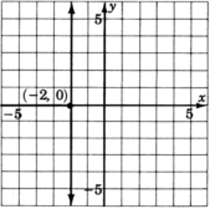
An argument similar to the one above will show that if the only variable that appears is , we can expect to get a vertical line.
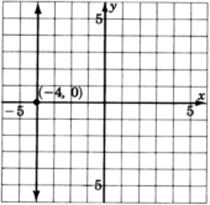
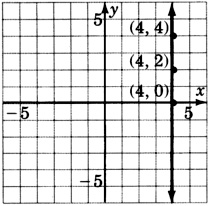
Graph
.
The only variable appearing is
. Regardless of which
we choose, the
is always 4. All points with a
of 4 satisfy the equation. Thus we get a horizontal line 4 unit above the
.
| 4 | ||
| 4 | ||
| 4 | ||
| 0 | 4 | |
| 1 | 4 | |
| 2 | 4 | |
| 3 | 4 | |
| 4 | 4 |
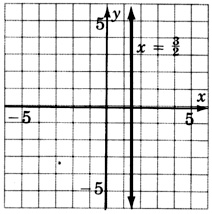
Graph
.
The only variable that appears is
. Regardless of which
we choose, the
will always be
. Thus, we get a vertical line two units to the left of the
.
| 0 | ||
| 1 | ||
| 2 | ||
| 3 | ||
| 4 |
For the following problems, graph the equations.
Construct the graph of all the points that have coordinates
, that is, for each point, the
and
are the same.
( [link] ) Name the property of real numbers that makes a true statement.
commutative property of addition
(
[link] ) Supply the missing word. The absolute value of a number
, denoted
, is the
( [link] ) Solve the equation .
(
[link] ) Supply the missing word. The coordinate axes divide the plane into four equal regions called
quadrants
Notification Switch
Would you like to follow the 'Elementary algebra' conversation and receive update notifications?

|
|
|
|
|

|
|

|
|

|
|

|
|

|
|

|
|

|
|

|
|

|
|

|