We then substitute this into the equation of the graph (i.e.
) to determine the
-coordinate of the turning point:
This corresponds to the point that we have previously calculated.
Calculate the turning points of the graph of the function
.
Using the rules of differentiation we get:
Therefore, the turning points are at
and
.
The turning points of the graph of
are (2,-11) and (1,-10).
We are now ready to sketch graphs of functions.
Method:
Sketching Graphs:
Suppose we are given that
, then there are
five steps to be followed to sketch the graph of the function:
If
, then the graph is increasing from left to right, and may have a maximum and a minimum. As
increases, so does
. If
, then the graph decreasing is from left to right, and has first a minimum and then a maximum.
decreases as
increases.
Determine the value of the
-intercept by substituting
into
Determine the
-intercepts by factorising
and solving for
. First try to eliminate constant common factors, and to group like terms together so that the expression is expressed as economically as possible. Use the factor theorem if necessary.
Find the turning points of the function by working out the derivative
and setting it to zero, and solving for
.
Determine the
-coordinates of the turning points by substituting the
values obtained in the previous step, into the expression for
.
Use the information you're given to plot the points and get a rough idea of the gradients between points. Then fill in the missing parts of the function in a smooth, continuous curve.
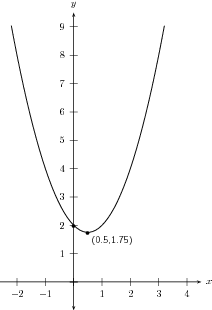
Draw the graph of
The
-intercept is obtained by setting
.
The turning point is at (0,2).
The
-intercepts are found by setting
.
Using the quadratic formula and looking at
we can see that this would be negative and so this function does not have real roots. Therefore, the graph of
does not have any
-intercepts.
Work out the derivative
and set it to zero to for the
coordinate of the turning point.
coordinate of turning point is given by calculating
.
The turning point is at
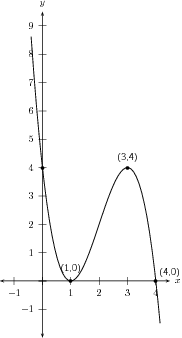
Sketch the graph of
.
Find the turning points by setting
.
If we use the rules of differentiation we get
The
-coordinates of the turning points are:
and
.
The
-coordinates of the turning points are calculated as:
Therefore the turning points are:
and
.
We find the
-intercepts by finding the value for
.
We find the
-intercepts by finding the points for which the function
.
Use the factor theorem to confirm that
is a factor. If
, then
is a factor.
Therefore,
is a factor.
If we divide
by
we are left with:
This has factors
Therefore:
The
-intercepts are:
Sketching graphs
Given
:
Show that
is a factor of
and hence fatorise
fully.
Find the coordinates of the intercepts with the axes and the turning points and sketch the graph
Sketch the graph of
showing all the relative turning points and intercepts with the axes.
Sketch the graph of
, showing all intercepts with the axes and turning points.
Find the equation of the tangent to
at
.
Local minimum, local maximum and point of inflextion
If the derivative (
) is zero at a point, the gradient of the tangent at that point is zero. It means that a turning point occurs as seen in the previous example.
From the drawing the point (1;0) represents a
local minimum and the point (3;4) the
local maximum .
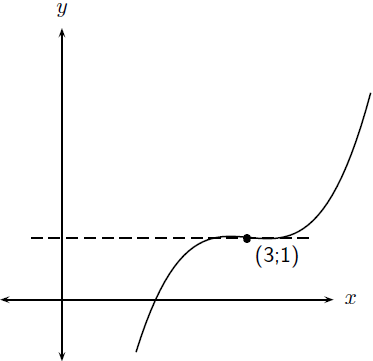
A graph has a horizontal
point of inflexion where the derivative is zero but the sign of the sign of the gradient does not change. That means the graph always increases or always decreases.
From this drawing, the point (3;1) is a horizontal point of inflexion, because the sign of the derivative does not change from positive to negative.