<< Chapter < Page Chapter >> Page >

Asia

While the majority of the world’s poorest countries are in Africa, the majority of the world’s poorest people are in Asia. As in Africa, Asia finds itself with disparity in the distribution of poverty, with Japan and South Korea holding much more wealth than India and Cambodia. In fact, most poverty is concentrated in South Asia. One of the most pressing causes of poverty in Asia is simply the pressure that the size of the population puts on its resources. In fact, many believe that China’s success in recent times has much to do with its draconian population control rules. According to the U.S. State department, China’s market-oriented reforms have contributed to its significant reduction of poverty and the speed at which it has experienced an increase in income levels (U.S. Department of State 2011b). However, every part of Asia is feeling the current global recession, from the poorest countries whose aid packages will be hit, to the more industrialized ones whose own industries are slowing down. These factors make the poverty on the ground unlikely to improve any time soon (World Poverty 2012b).

Latin america

Poverty rates in some Latin American countries like Mexico have improved recently, in part due to investment in education. But other countries like Paraguay and Peru continue to struggle. Although there is a large amount of foreign investment in this part of the world, it tends to be higher-risk speculative investment (rather than the more stable long-term investment Europe often makes in Africa and Asia). The volatility of these investments means that the region has been unable to leverage them, especially when mixed with high interest rates for aid loans. Further, internal political struggles, illegal drug trafficking, and corrupt governments have added to the pressure (World Poverty 2012c).

Argentina is one nation that suffered from increasing debt load in the early 2000s, as the country tried to fight hyperinflation by fixing the peso to the U.S. dollar. The move hurt the nation’s ability to be competitive in the world market and ultimately created chronic deficits that could only be financed by massive borrowing from other countries and markets. By 2001, so much money was leaving the country that there was a financial panic, leading to riots and ultimately, the resignation of the president.

Sweatshops and student protests: who’s making your team spirit?

A protester giving a speech is shown here.
This protester seeks to bring attention to the issue of sweatshops. (Photo courtesy of Ohio AFL-CIO Labor 2008/flickr)

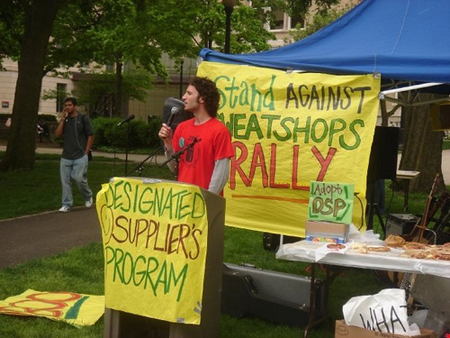
Most of us don’t pay too much attention to where our favorite products are made. And certainly when you’re shopping for a college sweatshirt or ball cap to wear to a school football game, you probably don’t turn over the label, check who produced the item, and then research whether or not the company has fair labor practices. But for the members of USAS––United Students Against Sweatshops––that’s exactly what they do. The organization, which was founded in 1997, has waged countless battles against both apparel makers and other multinational corporations that do not meet what USAS considers fair working conditions and wages (USAS 2009).

Sometimes their demonstrations take on a sensationalist tone, as in 2006 when 20 Penn State students protested while naked or nearly naked, in order to draw attention to the issue of sweatshop labor. The school is actually already a member of an independent monitoring organization called Worker Rights Consortium (WRC) that monitors working conditions and works to assist colleges and universities with maintaining compliance with their labor code. But the students were protesting in order to have the same code of conduct applied to the factories that provide materials for the goods, not just where the final product is assembled (Chronicle of Higher Education 2006).

The USAS organization has chapters on over 250 campuses in the United States and Canada and has waged countless campaigns against companies like Nike and Forever 21 apparel, Taco Bell restaurants, and Sodexo food service. In 2000, members of USAS helped to create WRC. Schools that affiliate with WRC pay annual fees that help offset the organization’s costs. Over 180 schools are affiliated with the organization. Yet, USAS still sees signs of inequality everywhere. And the members feel that, as current and future workers, it is within their scope of responsibility to ensure that workers of the world are treated fairly. For them, at least, the global inequality that we see everywhere should not be ignored for a team spirit sweatshirt.

Questions & Answers

What are the factors that affect demand for a commodity
Florence Reply
differentiate between demand and supply giving examples
Lambiv Reply
differentiated between demand and supply using examples
Lambiv
what is labour ?
Lambiv
how will I do?
Venny Reply
how is the graph works?I don't fully understand
Rezat Reply
information
Eliyee
devaluation
Eliyee
t
WARKISA
hi guys good evening to all
Lambiv
multiple choice question
Aster Reply
appreciation
Eliyee
explain perfect market
Lindiwe Reply
In economics, a perfect market refers to a theoretical construct where all participants have perfect information, goods are homogenous, there are no barriers to entry or exit, and prices are determined solely by supply and demand. It's an idealized model used for analysis,
Ezea
What is ceteris paribus?
Shukri Reply
other things being equal
AI-Robot
When MP₁ becomes negative, TP start to decline. Extuples Suppose that the short-run production function of certain cut-flower firm is given by: Q=4KL-0.6K2 - 0.112 • Where is quantity of cut flower produced, I is labour input and K is fixed capital input (K-5). Determine the average product of lab
Kelo
Extuples Suppose that the short-run production function of certain cut-flower firm is given by: Q=4KL-0.6K2 - 0.112 • Where is quantity of cut flower produced, I is labour input and K is fixed capital input (K-5). Determine the average product of labour (APL) and marginal product of labour (MPL)
Kelo
yes,thank you
Shukri
Can I ask you other question?
Shukri
what is monopoly mean?
Habtamu Reply
What is different between quantity demand and demand?
Shukri Reply
Quantity demanded refers to the specific amount of a good or service that consumers are willing and able to purchase at a give price and within a specific time period. Demand, on the other hand, is a broader concept that encompasses the entire relationship between price and quantity demanded
Ezea
ok
Shukri
how do you save a country economic situation when it's falling apart
Lilia Reply
what is the difference between economic growth and development
Fiker Reply
Economic growth as an increase in the production and consumption of goods and services within an economy.but Economic development as a broader concept that encompasses not only economic growth but also social & human well being.
Shukri
production function means
Jabir
What do you think is more important to focus on when considering inequality ?
Abdisa Reply
any question about economics?
Awais Reply
sir...I just want to ask one question... Define the term contract curve? if you are free please help me to find this answer 🙏
Asui
it is a curve that we get after connecting the pareto optimal combinations of two consumers after their mutually beneficial trade offs
Awais
thank you so much 👍 sir
Asui
In economics, the contract curve refers to the set of points in an Edgeworth box diagram where both parties involved in a trade cannot be made better off without making one of them worse off. It represents the Pareto efficient allocations of goods between two individuals or entities, where neither p
Cornelius
In economics, the contract curve refers to the set of points in an Edgeworth box diagram where both parties involved in a trade cannot be made better off without making one of them worse off. It represents the Pareto efficient allocations of goods between two individuals or entities,
Cornelius
Suppose a consumer consuming two commodities X and Y has The following utility function u=X0.4 Y0.6. If the price of the X and Y are 2 and 3 respectively and income Constraint is birr 50. A,Calculate quantities of x and y which maximize utility. B,Calculate value of Lagrange multiplier. C,Calculate quantities of X and Y consumed with a given price. D,alculate optimum level of output .
Feyisa Reply
Answer
Feyisa
c
Jabir
the market for lemon has 10 potential consumers, each having an individual demand curve p=101-10Qi, where p is price in dollar's per cup and Qi is the number of cups demanded per week by the i th consumer.Find the market demand curve using algebra. Draw an individual demand curve and the market dema
Gsbwnw Reply
suppose the production function is given by ( L, K)=L¼K¾.assuming capital is fixed find APL and MPL. consider the following short run production function:Q=6L²-0.4L³ a) find the value of L that maximizes output b)find the value of L that maximizes marginal product
Abdureman
Got questions? Join the online conversation and get instant answers!
Jobilize.com Reply

Get Jobilize Job Search Mobile App in your pocket Now!

Get it on Google Play Download on the App Store Now


Source:  OpenStax, Introduction to sociology. OpenStax CNX. Jun 12, 2012 Download for free at https://legacy.cnx.org/content/col11407/1.7
Google Play and the Google Play logo are trademarks of Google Inc.

Notification Switch

Would you like to follow the 'Introduction to sociology' conversation and receive update notifications?

Ask