<< Chapter < Page Chapter >> Page >
Qs = 2 + 5P

where Qs is the amount of pizza producers will supply (i.e., quantity supplied).

Finally, suppose that the personal pizza market operates where supply equals demand, or

Qd = Qs

We now have a system of three equations and three unknowns (Qd, Qs, and P), which we can solve with algebra:

Since Qd = Qs, we can set the demand and supply equation equal to each other:

Qd  =  Qs 16 – 2P  =  2 + 5P

Subtracting 2 from both sides and adding 2P to both sides yields:

16 – 2P – 2  =  2 + 5P – 2 14 – 2P  =  5P 14 – 2P + 2P  =  5P + 2P 14  =  7P 14 7  =  7P 7 2  =  P

In other words, the price of each personal pizza will be $2. How much will consumers buy?

Taking the price of $2, and plugging it into the demand equation, we get:

Qd  =  16 – 2P  =  16 – 2(2)  =  16 – 4  =  12

So if the price is $2 each, consumers will purchase 12. How much will producers supply? Taking the price of $2, and plugging it into the supply equation, we get:

Qs  =  2 + 5P  =  2 + 5(2)  =  2 + 10  =  12

So if the price is $2 each, producers will supply 12 personal pizzas. This means we did our math correctly, since Qd = Qs.

Solving Models with Graphs

If algebra is not your forte, you can get the same answer by using graphs. Take the equations for Qd and Qs and graph them on the same set of axes as shown in [link] . Since P is on the vertical axis, it is easiest if you solve each equation for P. The demand curve is then P = 8 – 0.5Qs and the demand curve is P = –0.4 + 0.2Qd. Note that the vertical intercepts are 8 and –0.4, and the slopes are –0.5 for demand and 0.2 for supply. If you draw the graphs carefully, you will see that where they cross (Qs = Qd), the price is $2 and the quantity is 12, just like the algebra predicted.

Supply and demand graph

The graph shows a downward sloping demand curve with endpoints (0, 8) and (16, 0), and an upward sloping supply curve. The demand curve and supply curve intersect at point (12, 2).
The equations for Qd and Qs are displayed graphically by the sloped lines.

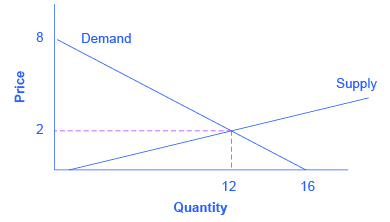
We will use graphs more frequently in this book than algebra, but now you know the math behind the graphs.

Growth rates

Growth rates are frequently encountered in real world economics. A growth rate is simply the percentage change in some quantity. It could be your income. It could be a business’s sales. It could be a nation’s GDP. The formula for computing a growth rate is straightforward:

Percentage change  =  Change in quantity Quantity

Suppose your job pays $10 per hour. Your boss, however, is so impressed with your work that he gives you a $2 per hour raise. The percentage change (or growth rate) in your pay is $2/$10 = 0.20 or 20%.

To compute the growth rate for data over an extended period of time, for example, the average annual growth in GDP over a decade or more, the denominator is commonly defined a little differently. In the previous example, we defined the quantity as the initial quantity—or the quantity when we started. This is fine for a one-time calculation, but when we compute the growth over and over, it makes more sense to define the quantity as the average quantity over the period in question, which is defined as the quantity halfway between the initial quantity and the next quantity. This is harder to explain in words than to show with an example. Suppose a nation’s GDP was $1 trillion in 2005 and $1.03 trillion in 2006. The growth rate between 2005 and 2006 would be the change in GDP ($1.03 trillion – $1.00 trillion) divided by the average GDP between 2005 and 2006 ($1.03 trillion + $1.00 trillion)/2. In other words:

Questions & Answers

how do you get the 2/50
Abba Reply
number of sport play by 50 student construct discrete data
Aminu Reply
width of the frangebany leaves on how to write a introduction
Theresa Reply
Solve the mean of variance
Veronica Reply
Step 1: Find the mean. To find the mean, add up all the scores, then divide them by the number of scores. ... Step 2: Find each score's deviation from the mean. ... Step 3: Square each deviation from the mean. ... Step 4: Find the sum of squares. ... Step 5: Divide the sum of squares by n – 1 or N.
kenneth
what is error
Yakuba Reply
Is mistake done to something
Vutshila
Hy
anas
hy
What is the life teble
anas
hy
Jibrin
statistics is the analyzing of data
Tajudeen Reply
what is statics?
Zelalem Reply
how do you calculate mean
Gloria Reply
diveving the sum if all values
Shaynaynay
let A1,A2 and A3 events be independent,show that (A1)^c, (A2)^c and (A3)^c are independent?
Fisaye Reply
what is statistics
Akhisani Reply
data collected all over the world
Shaynaynay
construct a less than and more than table
Imad Reply
The sample of 16 students is taken. The average age in the sample was 22 years with astandard deviation of 6 years. Construct a 95% confidence interval for the age of the population.
Aschalew Reply
Bhartdarshan' is an internet-based travel agency wherein customer can see videos of the cities they plant to visit. The number of hits daily is a normally distributed random variable with a mean of 10,000 and a standard deviation of 2,400 a. what is the probability of getting more than 12,000 hits? b. what is the probability of getting fewer than 9,000 hits?
Akshay Reply
Bhartdarshan'is an internet-based travel agency wherein customer can see videos of the cities they plan to visit. The number of hits daily is a normally distributed random variable with a mean of 10,000 and a standard deviation of 2,400. a. What is the probability of getting more than 12,000 hits
Akshay
1
Bright
Sorry i want to learn more about this question
Bright
Someone help
Bright
a= 0.20233 b=0.3384
Sufiyan
a
Shaynaynay
How do I interpret level of significance?
Mohd Reply
It depends on your business problem or in Machine Learning you could use ROC- AUC cruve to decide the threshold value
Shivam
how skewness and kurtosis are used in statistics
Owen Reply
yes what is it
Taneeya
Got questions? Join the online conversation and get instant answers!
Jobilize.com Reply

Get Jobilize Job Search Mobile App in your pocket Now!

Get it on Google Play Download on the App Store Now


Source:  OpenStax, Principles of macroeconomics for ap® courses. OpenStax CNX. Aug 24, 2015 Download for free at http://legacy.cnx.org/content/col11864/1.2
Google Play and the Google Play logo are trademarks of Google Inc.

Notification Switch

Would you like to follow the 'Principles of macroeconomics for ap® courses' conversation and receive update notifications?

Ask