

| << Chapter < Page | Chapter >> Page > |
Continuous-scene monitoring applications, such as ATM booths, parking lots or traffic monitoring systems, generate large volumes of data. Recording and archiving such volumes of data is a real problem, and one way to solve this is to reduce the size of the data stream right at the source.
In addition to traditional methods for compressing individual video images, we could identify and record only “interesting” video images, such as those images with significant amounts of motion in the field of view. That could significantly help reduce the data rates for surveillance-specific applications.
In this section, we’ll illustrate the design flow of a motion detection system based video surveillance system. The system will be able to identify and record only “interesting” video frames containing motion.
The development process will follow the following three steps:
This laboratory was originally developed using the following hardware and software:
In this session we will show how to create the line detection model, and how it can be integrated in Simulation and Real-Time Implementations.
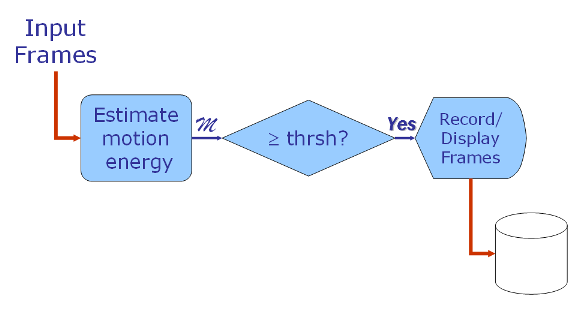
Figure 1: The Motion Detection Process
The Motion Energy estimation is based on the calculation of the Sum of Absolute Differences (SAD)” according to the following equation:
| where: | |
| - Current Frame | |
| - Previous Frame |
The Video Surveillance system block diagram is shown in Figure 2. The source video is displayed and played back through the system. This incoming video stream is processed by a subsystem that estimates the motion within the scene and captures the interesting video frames. The system can display either the recorded video frame or the Absolute Differences (AD) image.
The user can configure the motion energy threshold value and select which image will be displayed (Display Control). The system outputs include, besides the displayed image, the following features:
While the generated code is running on the target, a host side Simulink® model simultaneously sends video frames to the target via TCP/IP protocol using TCP/IP Blocks from Instrument Control Toolbox™. The target receives video frames sent by the host side Simulink model, computes the sum of the absolute value of differences (SAD) between successive video frames, and returns an estimate of motion. When the motion estimate value exceeds a threshold, the target increments a counter and sends the corresponding frame back to the host.
Notification Switch
Would you like to follow the 'From matlab and simulink to real-time with ti dsp's' conversation and receive update notifications?

|
|

|
|

|
|

|
|

|
|
|
|
|

|
|

|
|

|
|

|