

| << Chapter < Page | Chapter >> Page > |
(By now, you may be suspecting that I have a particular affinity for a data length of 400 samples. If so, you are correct. This is not a technicalaffinity. Rather, it is a visual one. These figures are formatted such that the plotted data occupies an area of the screen containing approximately 400pixels. By matching the plotted points to the positions of the pixels, it is possible to avoid, or at least minimize, the distortion that can occur whenattempting to map from sample points to pixel locations when there is a mismatch between the two.
To see the result of such mapping problems, repeat the experiment shown in Figure 2 and use your mouse to stretch the Frame horizontally by a very small amount. Depending on how much you stretch the Frame, you should seevertical lines disappear, vertical lines that are too close together, or a combination of the two. This is another manifestation of the impact ofsampling that I don't have the time to get into at this point.)
As you can see in Figure 4 , the length of the pulse for this experiment was 11 samples, all but one of which had a value of zero.
(In this case, I could have made the pulse length 1 but for simplicity, I will keep it at 11 for several different experiments.)
As you may have discovered by playing video games, we can do things with a computer that we can't do in the real world. For example, the Fourier transformprogram allows me to specify which sample I regard as representing zero time. Samples to the left of that sample represent negative time (history) and samples to the right of that one represent positive time (the future) .
In this case, I specified that the first sample (sample number 0) represents zero time. As you will see later, this has a significant impact on thedistribution of energy between the real and imaginary parts of the transform results, and as such, has a significant impact on the phase angle.
Because I am using a DFT algorithm (instead of an FFT algorithm) I can compute the Fourier transform across a range of frequencies of my choosing. Asshown in Figure 4 , I chose to compute the transform across the range of frequencies from zero to one-half the sampling frequency, known as the Nyquistfolding frequency. Thus, the spectral analysis was performed at 400 individual frequencies between these two limits.
The computational frequency range is followed in Figure 4 by the values of the samples that make up the pulse. Note that the first sample has a value of 180 while the other ten samplesall have a value of 0.
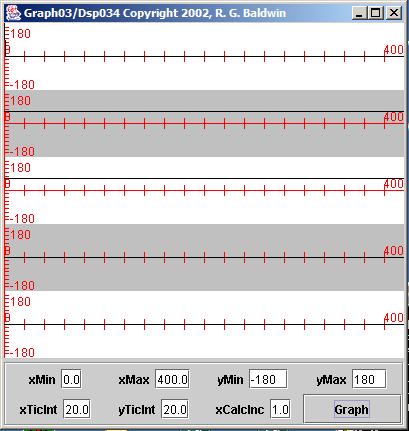
I used the program named Graph03 to plot the output from this program, and the results are shown in Figure 5 .
(Note that rather than plotting each sample value as a vertical bar, Graph03 plots each sample as a dot and connects the dots with straight line segments.)
| Figure 5. Spectral analysis of an impulse at zero time. |
|---|
 |
Notification Switch
Would you like to follow the 'Digital signal processing - dsp' conversation and receive update notifications?

|
|

|
|

|
|

|
|

|
|

|
|

|
|

|
|

|
|

|