

| << Chapter < Page | Chapter >> Page > |
Because of the shorter wavelengths involved, typical radar sensors are usually small enough that they can be physically turned and tilted. Thus, it isnot unusual to see radar sensors turning around and tilting up and down. Although I'm not personally aware of any applications that use arrays of radarsensors, my suspicion is that there probably are some being used in fixed air surveillance operations.
A large percentage of petroleum exploration involves the insertion of a powerful surge of acoustic energy into the ground (or into the ocean) and listening for and recording the echo signals returned by the various layers ofthe earth. By moving across the earth and repeating this process, a profile of the earth's layering can be produced. An experienced exploration geophysicist can examine the profiles and reach conclusions as to the likelihoodthat a particular stratum contains petroleum.
Exploration geophysicists have been using arrays of sensors for this purpose for at least the past 55 years according to my personal knowledge, and probablyfor many years before that.
While the examples described above are interesting, they are beyond the scope of anything that I can demonstrate online. However, there are severalinteresting applications using 2D Fourier transforms that I can demonstrate online. One of those applications is image processing.
Future modules will show how to use 2D Fourier transforms for such purposes as softening images, sharpening images, doing edge detection on images, etc. Forthis application, it is satisfactory to use a 2D Fourier transform program that assumes that the space domain data is purely real. Therefore, the program that Iwill present and explain in Part 2 of this module will make that assumption.
The 2D Fourier transform will be used in future modules to help explain how and why 2D image convolution behaves the way it does. A preview of that materialis shown in Figure 6 .
| Figure 6. Image processing in the space domain. |
|---|
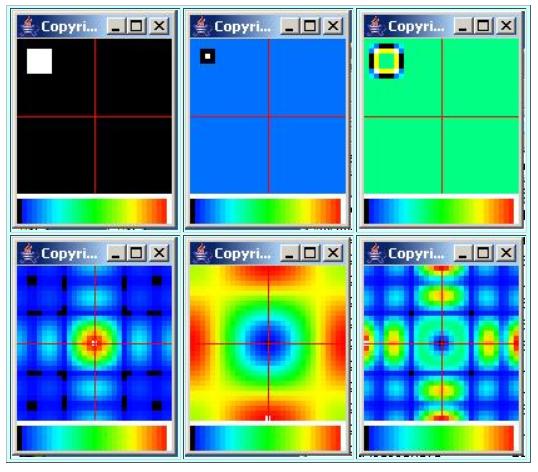 |
Convolution in the space domain is equivalent to multiplication in the wavenumber domain, and vice versa.
The top left image in Figure 6 shows a simple 3D surface in space consisting of a raised square. The wavenumber spectrum of that surface is shown in thelower left image in Figure 6 . Note that the spectrum has a peak at a wavenumber value of zero with low values at the higher wave numbers near the edges. Thepeak in the center is relatively narrow with respect to the folding wave number at the edges.
The image in the upper center of Figure 6 shows a typical 2D convolution operator consisting of a value of +8 in the center surrounded by eightcoefficients each having a value of -1.
The wavenumber spectral response of that convolution operator is shown in the lower center. Note that it has peaks at the folding wavenumbers on all foursides with a low value in the center.
Notification Switch
Would you like to follow the 'Digital signal processing - dsp' conversation and receive update notifications?

|
|

|
|

|
|

|
|

|
|
|
|
|

|
|

|
|

|
|

|