<< Chapter < Page
  From matlab and simulink to real     Page 1 / 3
Chapter >> Page >
Wavelets can be used in a wide range of applications, one of which is noise reduction. This module shows a real-time implementation of a wavelet-based noise reduction in the DSK6713. A Simulink model is created for simulation, and afterwards used for DSP code generation.

Introduction

Wavelets can be used in a range of applications, one of which is noise reduction.

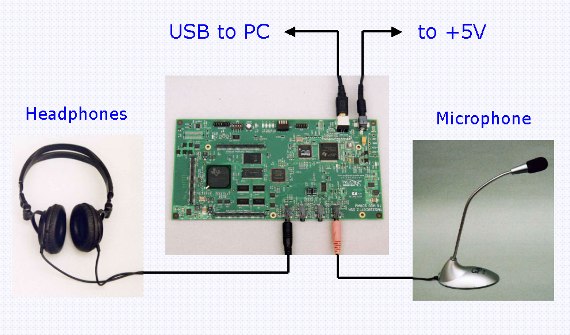
This laboratory shows how to design a model of Wavelet Noise Reduction using Simulink and run it on a Texas Instruments C6000 DSP.

Objectives

  • Design a model of Wavelet Noise Reduction for the Texas Instruments C6000 family of DSP devices using MATLAB® and Simulink®.
  • Modify an existing Simulink demonstration model.
  • Run the project on the Texas Instruments C6713 DSK with a microphone and computer loudspeakers / headphones.

Level

Intermediate. Assumes prior knowledge of MATLAB and Simulink. It also requires a theoretical understanding of wavelets and some knowledge of Texas Instruments DSPs.

Hardware and software requirements

This laboratory was originally developed using the following hardware and software:

  • MATLAB R2006b with Embedded Target for TI C6000.
  • Code Composer Studio (CCS) v3.1
  • Texas Instruments C6713 DSK hardware.
  • Microphone and computer loudspeakers / headphones.

Simulation

The Simulink model described here is based on a MATLAB Demo.

Opening the model

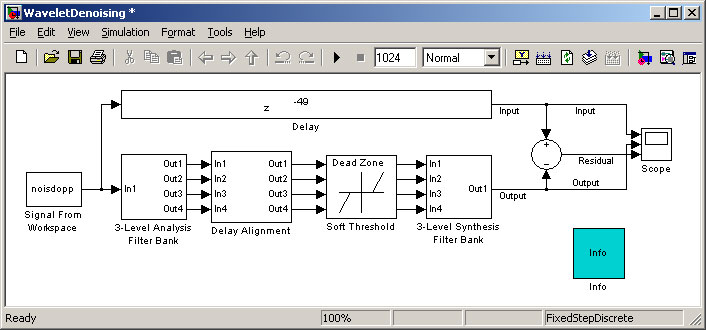
Open WaveletDenoising.mdl

Opening WaveletDenoising.mdl

Running the model

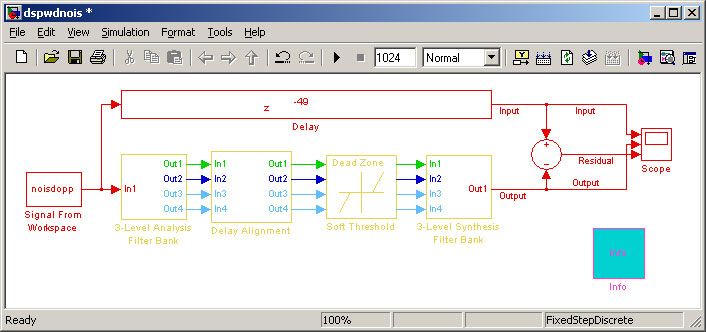
Run the model. The colors change to show the different filter channels. Green = high frequency.

Wavelet Model Showing Color Coding

Scope output

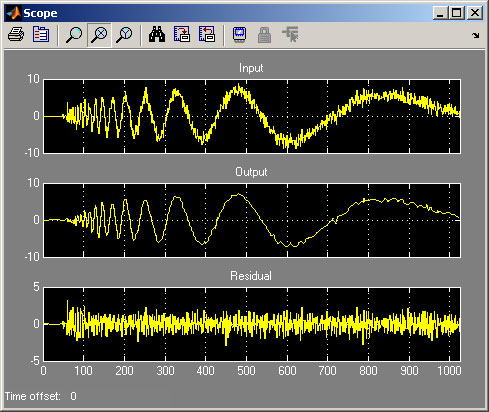
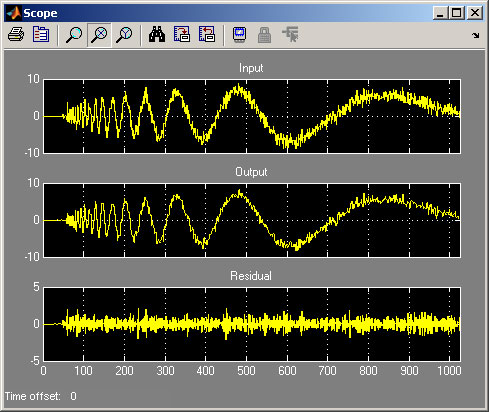
The scope output shows how the random noise has been separated out (Residual).

Scope Output

Monitoring the dyadic filter outputs

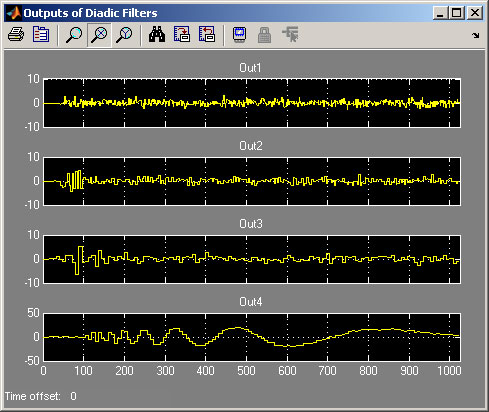
Add an extra scope as shown in Figure 4 to display the Diadic Filter Outputs.

Monitoring the Dyadic Filter Outputs

Analysis of diadic filter outputs

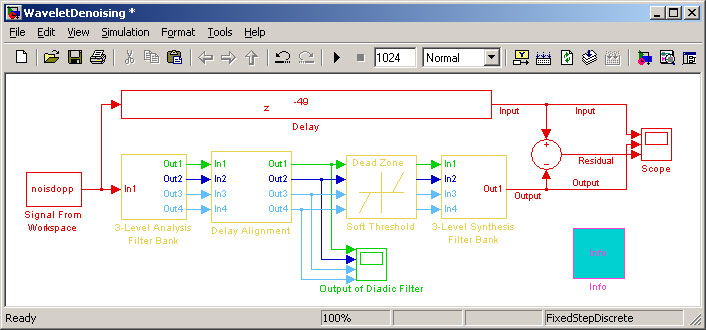
It can be seen that the noise is on Out1, Out2 and Out3. The clean input signal is on Out4.

Noise Levels at Dyadic Filter Outputs

Modifying the dead zone

Double-click on the “Soft Threshold” block. This is the actual noise reduction stage. The fields are in order Out1, Out2, Out3 and Out4.

Noise Levels at Dyadic Filter Outputs

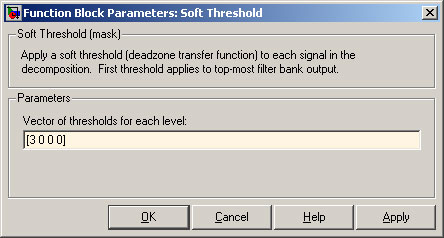
Here Out1 has been given a threshold of 3. This means that only values>3 are let through.

Out2, Out3 and Out4 have been given the value of 0. This means the whole signal is let through.

The output is shown in Figure 6. Note that the noise associated with Out2 and Out3 have not been reduced.

Threshold only applied to Out1

Changing the delay alignment

Double-click on the “Delay Alignment” block. Temporarily remove the delays on Out1 and Out2.

Removing the Delay Alignments

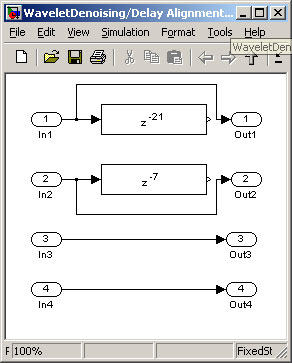
Run the model to see the effect.

Summary of simulation

From practical experimentation using the Simulink model, you should now understand how wavelet denoising works.

Real-time model for ti c6713 dsk

Texas instruments c6713 dsk setup

Texas Instruments C6713 DSK Setup

Questions & Answers

how do you get the 2/50
Abba Reply
number of sport play by 50 student construct discrete data
Aminu Reply
width of the frangebany leaves on how to write a introduction
Theresa Reply
Solve the mean of variance
Veronica Reply
Step 1: Find the mean. To find the mean, add up all the scores, then divide them by the number of scores. ... Step 2: Find each score's deviation from the mean. ... Step 3: Square each deviation from the mean. ... Step 4: Find the sum of squares. ... Step 5: Divide the sum of squares by n – 1 or N.
kenneth
what is error
Yakuba Reply
Is mistake done to something
Vutshila
Hy
anas
hy
What is the life teble
anas
hy
Jibrin
statistics is the analyzing of data
Tajudeen Reply
what is statics?
Zelalem Reply
how do you calculate mean
Gloria Reply
diveving the sum if all values
Shaynaynay
let A1,A2 and A3 events be independent,show that (A1)^c, (A2)^c and (A3)^c are independent?
Fisaye Reply
what is statistics
Akhisani Reply
data collected all over the world
Shaynaynay
construct a less than and more than table
Imad Reply
The sample of 16 students is taken. The average age in the sample was 22 years with astandard deviation of 6 years. Construct a 95% confidence interval for the age of the population.
Aschalew Reply
Bhartdarshan' is an internet-based travel agency wherein customer can see videos of the cities they plant to visit. The number of hits daily is a normally distributed random variable with a mean of 10,000 and a standard deviation of 2,400 a. what is the probability of getting more than 12,000 hits? b. what is the probability of getting fewer than 9,000 hits?
Akshay Reply
Bhartdarshan'is an internet-based travel agency wherein customer can see videos of the cities they plan to visit. The number of hits daily is a normally distributed random variable with a mean of 10,000 and a standard deviation of 2,400. a. What is the probability of getting more than 12,000 hits
Akshay
1
Bright
Sorry i want to learn more about this question
Bright
Someone help
Bright
a= 0.20233 b=0.3384
Sufiyan
a
Shaynaynay
How do I interpret level of significance?
Mohd Reply
It depends on your business problem or in Machine Learning you could use ROC- AUC cruve to decide the threshold value
Shivam
how skewness and kurtosis are used in statistics
Owen Reply
yes what is it
Taneeya
Got questions? Join the online conversation and get instant answers!
Jobilize.com Reply

Get Jobilize Job Search Mobile App in your pocket Now!

Get it on Google Play Download on the App Store Now


Source:  OpenStax, From matlab and simulink to real-time with ti dsp's. OpenStax CNX. Jun 08, 2009 Download for free at http://cnx.org/content/col10713/1.1
Google Play and the Google Play logo are trademarks of Google Inc.

Notification Switch

Would you like to follow the 'From matlab and simulink to real-time with ti dsp's' conversation and receive update notifications?

Ask