

| << Chapter < Page | Chapter >> Page > |
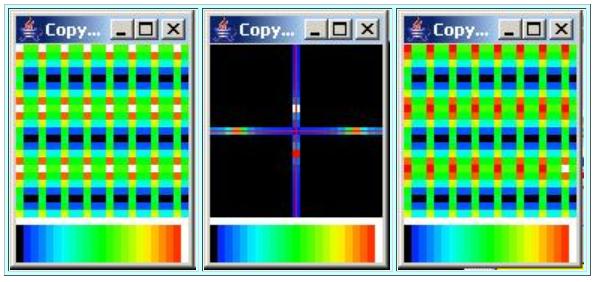
(Recall that for the plotting format used in Figure 14 , the color white is reserved for the single point with the highest elevation. Thedifference in an elevation colored white and an elevation colored red for this plotting format might be as small as one part in ten to the fourteenthor fifteenth power. As a practical matter, red and white indicate the same elevation for this plotting format.)
For a sinusoidal surface with eight samples per cycle, we would expect the peaks to occur in the wavenumber spectrum about one-fourth of the distance fromthe origin to the folding wavenumber. Figure 14 meets that expectation.
The peaks are surrounded on both sides by blue and cyan colors, indicating very low values.
The output from the inverse Fourier transformed performed on the complex spectrum is shown in the rightmost image in Figure 14 . This output compares very favorably with the input surface shown in the leftmost image. The differencebetween the two is that the input has white vertical bands whereas the output has red vertical bands (with a single white spot) . The above explanation of white versus red applies here also.
You can view the code that created this surface in Listing 22 near the end of the module.
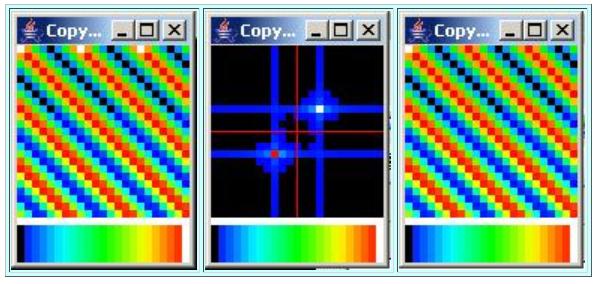
This case draws a sinusoidal surface on the horizontal axis with three samples per cycle plus a sinusoidal surface on the vertical axis with eightsamples per cycle as shown by the leftmost image in Figure 15 .
| Figure 15. Graphic output for Case 12. |
|---|
 |
Performing a forward Fourier transform produces symmetrical peaks on the horizontal and vertical axes on all four sides of the wave number origin. Thesepeaks are indicated by the red and white squares in the center image in Figure 15 .
(See the earlier discussion regarding the difference in elevation indicated by red and white for this plotting format.)
The peaks on the vertical axis should be about one-fourth of the way between the origin and the folding wavenumber. This appears to be the case. The peaks onthe horizontal axis should be about two-thirds of the way between the origin and the folding wavenumber, which they also appear to be.
The output produced by performing an inverse Fourier transform on the complex spectrum is shown in the rightmost image in Figure 15 . Taking the red versus white issue into account, this output compares favorably with the input surface shown in theleftmost image in Figure 15 .
You can view the code that created this surface in Listing 22 near the end of the module.
This case draws a sinusoidal surface at an angle of approximately 45 degrees relative to the horizontal as shown in the leftmost image in Figure 16 . This sinusoid has approximately eight samples per cycle.
| Figure 16. Graphic output for Case 13. |
|---|
 |
Performing a forward Fourier transform on this surface produces a pair of peaks in the wavenumber spectrum that are symmetrical about the origin atapproximately 45 degrees relative to the horizontal axis. These peaks are indicated by the red and white squares in the center image in Figure 16 .
Notification Switch
Would you like to follow the 'Digital signal processing - dsp' conversation and receive update notifications?

|
|

|
|

|
|

|
|

|
|

|
|
|
|
|

|
|

|
|

|