

| << Chapter < Page | Chapter >> Page > |
As you can see from Listing 6 , the values that make up the pulse are produced by adding together the values of two different cosine functions having differentfrequencies. The values for freq1 and freq2 are as described above.
You can view the remainder of this program in Listing 11 .
The results of running the program named Dsp032 and displaying the results with the program named Graph03 are shown in Figure 5 .
| Figure 5. Spectral analyses of five pulses. |
|---|
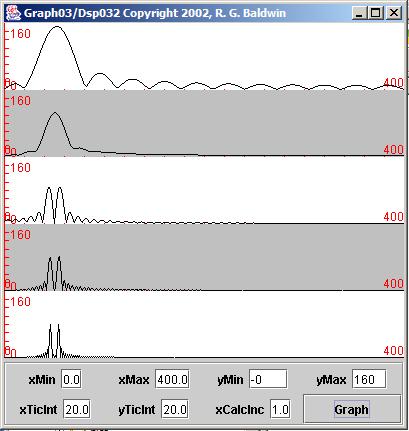 |
Each of the peaks in the third, fourth, and fifth plots in Figure 5 corresponds to the frequency of one of the two sinusoids that were addedtogether to produce the pulses shown in Figure 4 .
The question posed in the original hypothetical situation was "how long must the operating bursts of this device be in order for you to resolve the peaks and identify the enemy submarine under ideal conditions?"
We are looking at very ideal conditions in Figure 4 and Figure 5 . In particular, the pulses exist completely in the absence of noise.
(The existence of wide-band noise added to the pulses in Figure 4 would cause a change in the spectral results in Figure 5 . That change might be described as having the appearance of grass and weeds growing on thebaseline across the entire spectrum. The stronger the wide-band noise, the taller would be the weeds.)
Clearly for the ideal condition of recording the bursts in the total absence of noise, you cannot resolve the peaks from the top two plots in Figure 5 . For those two pulses, the spectral peaks simply merge together to form a singlebroad peak. Therefore, for this amount of separation between the frequencies of the two sinusoids, the lengths of the first two pulses in Figure 4 are insufficient to allow for separation and identification of the separate peaks.
We seem to have the problem bracketed. (Were we really lucky, or did I plan it this way?) Under the ideal conditions of this experiment, the peaks are separable in the middle plot of Figure 5 . Thus, for the amount of separation between the frequencies of the two sinusoids, the length of the third pulse is Figure 4 is sufficient to allow for separation and identification of the separate peaks.
The peaks are even better separated in the bottom two plots in Figure 5 . For the five pulses used in this experiment and the amount of separation between thefrequencies of the two sinusoids, any pulse as long or longer than the length of the third pulse is Figure 4 is sufficient to allow for separation and identification of the separate peaks.
If you were to add a nominal amount of wide-band noise to the mix, it would become more difficult to resolve the peaks for the bottom three plots in Figure 5 because the peaks would be growing out of a bed of weeds.
(If you add enough wide-band noise, you couldn't resolve the peaks using any of the plots, because the peaks would be completely "lost in thenoise.")
Notification Switch
Would you like to follow the 'Digital signal processing - dsp' conversation and receive update notifications?

|
|

|
|

|
|

|
|

|
|

|
|

|
|

|
|
|
|
|

|