

| << Chapter < Page | Chapter >> Page > |
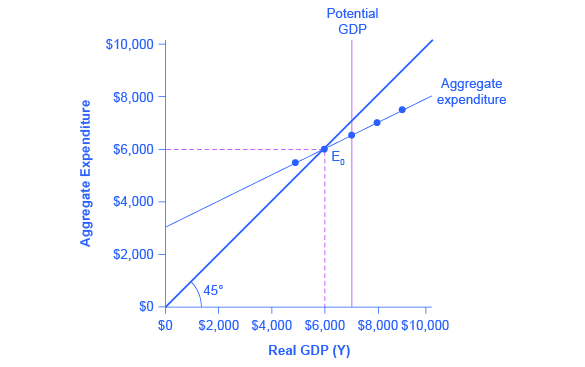
All the components of aggregate demand—consumption, investment, government spending, and the trade balance—are now in place to build the Keynesian cross diagram. [link] builds up an aggregate expenditure function, based on the numerical illustrations of C, I, G, X, and M that have been used throughout this text. The first three columns in [link] are lifted from the earlier [link] , which showed how to bring taxes into the consumption function. The first column is real GDP or national income, which is what appears on the horizontal axis of the income-expenditure diagram. The second column calculates after-tax income, based on the assumption, in this case, that 30% of real GDP is collected in taxes. The third column is based on an MPC of 0.8, so that as after-tax income rises by $700 from one row to the next, consumption rises by $560 (700 × 0.8) from one row to the next. Investment, government spending, and exports do not change with the level of current national income. In the previous discussion, investment was $500, government spending was $1,300, and exports were $840, for a total of $2,640. This total is shown in the fourth column. Imports are 0.1 of real GDP in this example, and the level of imports is calculated in the fifth column. The final column, aggregate expenditures, sums up C + I + G + X – M. This aggregate expenditure line is illustrated in [link] .
| National Income | After-Tax Income | Consumption | Government Spending + Investment + Exports | Imports | Aggregate Expenditure |
|---|---|---|---|---|---|
| $3,000 | $2,100 | $2,280 | $2,640 | $300 | $4,620 |
| $4,000 | $2,800 | $2,840 | $2,640 | $400 | $5,080 |
| $5,000 | $3,500 | $3,400 | $2,640 | $500 | $5,540 |
| $6,000 | $4,200 | $3,960 | $2,640 | $600 | $6,000 |
| $7,000 | $4,900 | $4,520 | $2,640 | $700 | $6,460 |
| $8,000 | $5,600 | $5,080 | $2,640 | $800 | $6,920 |
| $9,000 | $6,300 | $5,640 | $2,640 | $900 | $7,380 |
The aggregate expenditure function is formed by stacking on top of each other the consumption function (after taxes), the investment function, the government spending function, the export function, and the import function. The point at which the aggregate expenditure function intersects the vertical axis will be determined by the levels of investment, government, and export expenditures—which do not vary with national income. The upward slope of the aggregate expenditure function will be determined by the marginal propensity to save, the tax rate, and the marginal propensity to import. A higher marginal propensity to save, a higher tax rate, and a higher marginal propensity to import will all make the slope of the aggregate expenditure function flatter—because out of any extra income, more is going to savings or taxes or imports and less to spending on domestic goods and services.
Notification Switch
Would you like to follow the 'Principles of macroeconomics for ap® courses' conversation and receive update notifications?

|
|
|
|
|

|
|

|
|

|
|

|
|

|
|

|
|

|
|

|
|

|
|

|