

| << Chapter < Page | Chapter >> Page > |
Having discussed the features of the interactive FFT tool that I used to produce many of the images in this module, it is time to get back to thediscussion of the Fourier transform as a linear transform. The fact that the Fourier transform is a linear transform is illustrated in Figure 1 , Figure 2 , and Figure 3 .
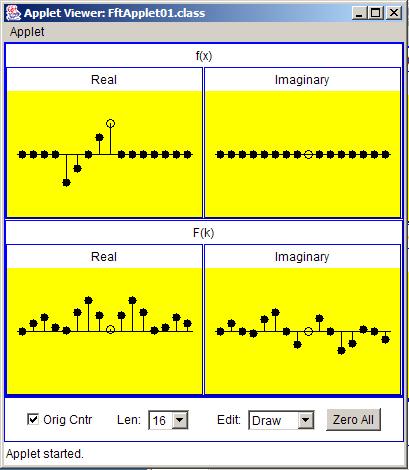
In these three figures, the input series is shown in the real area in the upper left. For simplification, the values of the imaginary part of theinput series shown in the upper right are all zero.
Also, for simplification, the zero origin is shown in the center by the value with the empty circle.
The real and imaginary parts of the transform output are shown in the bottom of each figure.
Figure 1 shows an input series consisting of a pulse that starts with a high value at the origin and extends down and to the right for five samples,ending in a large negative value.
This input series produces a rather complicated transform output series, as can be seen in the bottom two boxes in Figure 1 . I will come back to a discussion of the transform output later.
Figure 2 shown an input series consisting of a pulse that begins with a large negative value four samples to the left of the origin and extends upand to the right ending with a large positive value at the origin. The input series in Figure 2 is the mirror image of the input series in Figure 1 relative to the origin.
| Figure 2. Transform of pulse with positive slope. |
|---|
 |
Once again, the output from the transform of the input series is shown in the bottom two boxes of Figure 2 .
A comparison of the real part of each of the transforms for Figure 1 and Figure 2 shows that the real parts are the same, at least insofar as I was able to control the input by interactively adjusting the locations of thecircles using the mouse.
A comparison of the imaginary part of each of the transforms shows that the imaginary parts are the same except for the algebraic sign of each ofthe values in the imaginary part. The algebraic sign of each of the values in Figure 2 is the reverse of the algebraic sign of each of the values in Figure 1 .
To demonstrate that the Fourier transform is a linear transform, I will create a new input series that is the sum of the input series from Figure 1 and Figure 2 . I will show that the transform of the sum is the sum of the transforms. This is shown in Figure 3 .
| Figure 3. Transform of the sum of two pulses. |
|---|
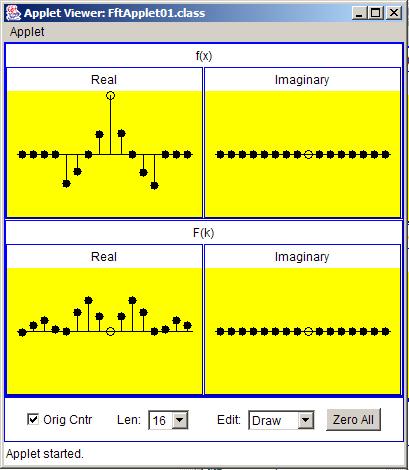 |
Figure 3 shows an input series that is the sum of the individual input series from Figure 1 and Figure 2 . This produces a pulse that is symmetric around the origin indicated by the value with the empty circle.
Note that the display of the transform values produced by this applet is normalized so as to keep them in a reasonable range for plotting. As aresult, absolute values don't have much meaning. Only relative values have meaning.
Notification Switch
Would you like to follow the 'Digital signal processing - dsp' conversation and receive update notifications?

|
|

|
|

|
|

|
|

|
|

|
|
|
|
|

|
|

|
|

|