<< Chapter < Page Chapter >> Page >

[link] summarizes these types of decay, along with their equations and changes in atomic and mass numbers.
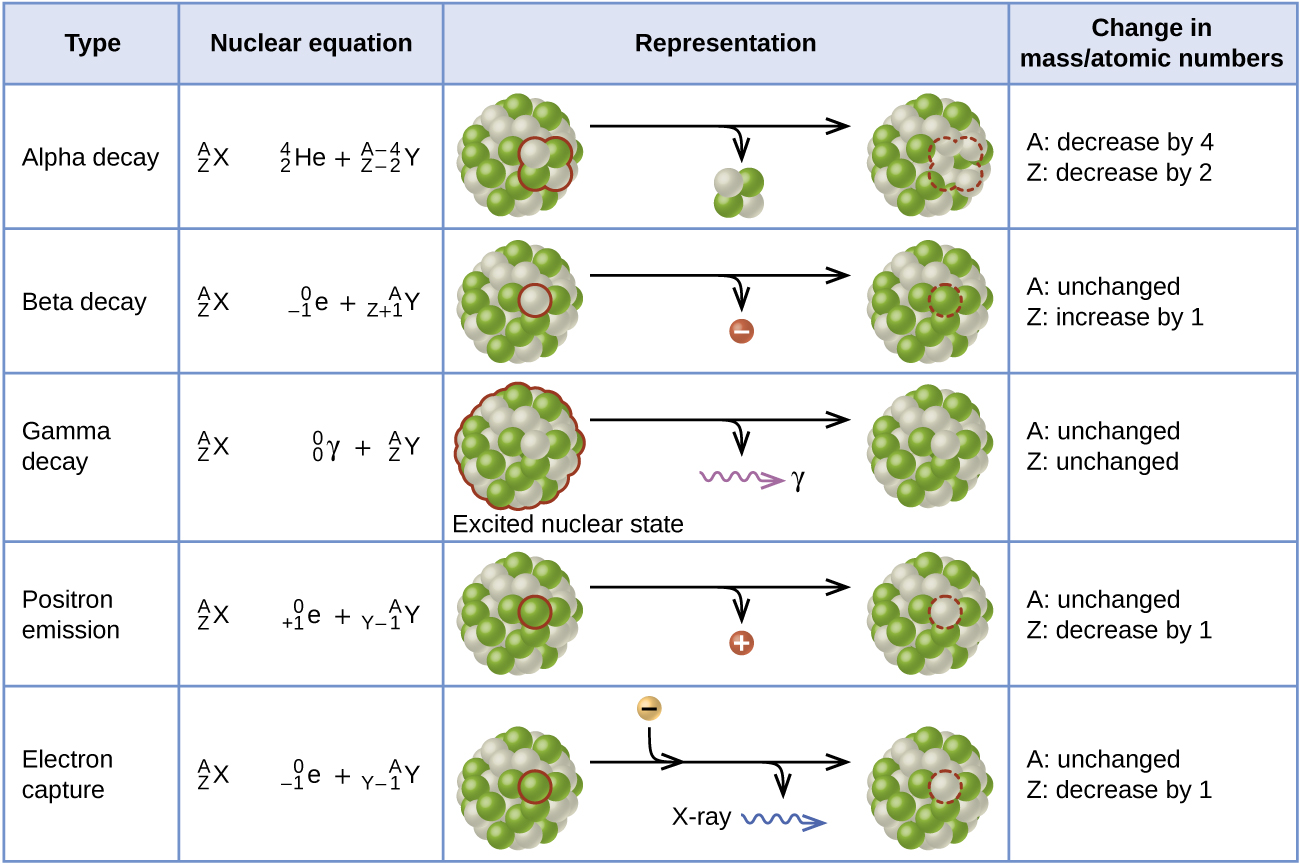
This table has four columns and six rows. The first row is a header row and it labels each column: “Type,” “Nuclear equation,” “Representation,” and “Change in mass / atomic numbers.” Under the “Type” column are the following: “Alpha decay,” “Beta decay,” “Gamma decay,” “Positron emission,” and “Electron capture.” Under the “Nuclear equation” column are several equations. Each begins with superscript A stacked over subscript Z X. There is a large gap of space and then the following equations: “superscript 4 stacked over subscript 2 He plus superscript A minus 4 stacked over subscript Z minus 2 Y,” “superscript 0 stacked over subscript negative 1 e plus superscript A stacked over subscript Z plus 1 Y,” “superscript 0 stacked over subscript 0 lowercase gamma plus superscript A stacked over subscript Z Y,” “superscript 0 stacked over subscript positive 1 e plus superscript A stacked over subscript Y minus 1 Y,” and “superscript 0 stacked over subscript negative 1 e plus superscript A stacked over subscript Y minus 1 Y.” Under the “Representation” column are the five diagrams. The first shows a cluster of green and white spheres. A section of the cluster containing two white and two green spheres is outlined. There is a right-facing arrow pointing to a similar cluster as previously described, but the outlined section is missing. From the arrow another arrow branches off and points downward. The small cluster to two white spheres and two green spheres appear at the end of the arrow. The next diagram shows the same cluster of white and green spheres. One white sphere is outlined. There is a right-facing arrow to a similar cluster, but the white sphere is missing. Another arrow branches off the main arrow and a red sphere with a negative sign appears at the end. The next diagram shows the same cluster of white and green spheres. The whole sphere is outlined and labeled, “excited nuclear state.” There is a right-facing arrow that points to the same cluster. No spheres are missing. Off the main arrow is another arrow which points to a purple squiggle arrow which in turn points to a lowercase gamma. The next diagram shows the same cluster of white and green spheres. One green sphere is outlined. There is a right-facing arrow to a similar cluster, but the green sphere is missing. Another arrow branches off the main arrow and a red sphere with a positive sign appears at the end. The next diagram shows the same cluster of white and green spheres. One green sphere is outlined. There is a right-facing arrow to a similar cluster, but the green sphere is missing. Two other arrows branch off the main arrow. The first shows a gold sphere with a negative sign joining with the right-facing arrow. The secon points to a blue squiggle arrow labeled, “X-ray.” Under the “Change in mass / atomic numbers” column are the following: “A: decrease by 4, Z: decrease by 2,” “A: unchanged, Z: increased by 1,” “A: unchanged, Z: unchanged,” “A: unchanged, Z: unchanged,” “A: unchanged, Z: decrease by 1,” and “A: unchanged, Z: decrease by 1.”
This table summarizes the type, nuclear equation, representation, and any changes in the mass or atomic numbers for various types of decay.

Pet scan

Positron emission tomography (PET) scans use radiation to diagnose and track health conditions and monitor medical treatments by revealing how parts of a patient’s body function ( [link] ). To perform a PET scan, a positron-emitting radioisotope is produced in a cyclotron and then attached to a substance that is used by the part of the body being investigated. This “tagged” compound, or radiotracer, is then put into the patient (injected via IV or breathed in as a gas), and how it is used by the tissue reveals how that organ or other area of the body functions.
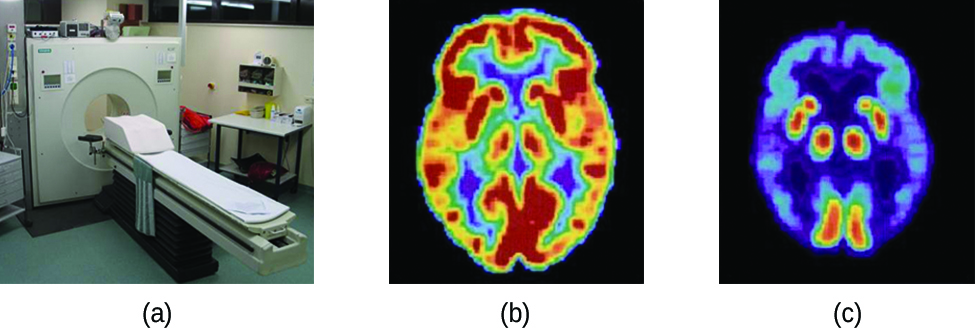
Three pictures are shown and labeled “a,” “b” and “c.” Picture a shows a machine with a round opening connected to an examination table. Picture b is a medical scan of the top of a person’s head and shows large patches of yellow and red and smaller patches of blue, green and purple highlighting. Picture c also shows a medical scan of the top of a person’s head, but this image is mostly colored in blue and purple with very small patches of red and yellow.
A PET scanner (a) uses radiation to provide an image of how part of a patient’s body functions. The scans it produces can be used to image a healthy brain (b) or can be used for diagnosing medical conditions such as Alzheimer’s disease (c). (credit a: modification of work by Jens Maus)

For example, F-18 is produced by proton bombardment of 18 O ( 8 18 O + 1 1 p 9 18 F + 0 1 n ) and incorporated into a glucose analog called fludeoxyglucose (FDG). How FDG is used by the body provides critical diagnostic information; for example, since cancers use glucose differently than normal tissues, FDG can reveal cancers. The 18 F emits positrons that interact with nearby electrons, producing a burst of gamma radiation. This energy is detected by the scanner and converted into a detailed, three-dimensional, color image that shows how that part of the patient’s body functions. Different levels of gamma radiation produce different amounts of brightness and colors in the image, which can then be interpreted by a radiologist to reveal what is going on. PET scans can detect heart damage and heart disease, help diagnose Alzheimer’s disease, indicate the part of a brain that is affected by epilepsy, reveal cancer, show what stage it is, and how much it has spread, and whether treatments are effective. Unlike magnetic resonance imaging and X-rays, which only show how something looks, the big advantage of PET scans is that they show how something functions. PET scans are now usually performed in conjunction with a computed tomography scan.

Radioactive decay series

The naturally occurring radioactive isotopes of the heaviest elements fall into chains of successive disintegrations, or decays, and all the species in one chain constitute a radioactive family, or radioactive decay series    . Three of these series include most of the naturally radioactive elements of the periodic table. They are the uranium series, the actinide series, and the thorium series. The neptunium series is a fourth series, which is no longer significant on the earth because of the short half-lives of the species involved. Each series is characterized by a parent (first member) that has a long half-life and a series of daughter nuclides that ultimately lead to a stable end-product—that is, a nuclide on the band of stability ( [link] ). In all three series, the end-product is a stable isotope of lead. The neptunium series, previously thought to terminate with bismuth-209, terminates with thallium-205.

Questions & Answers

it is the relatively stable flow of income
Chidubem Reply
what is circular flow of income
Divine Reply
branches of macroeconomics
SHEDRACK Reply
what is Flexible exchang rate?
poudel Reply
is gdp a reliable measurement of wealth
Atega Reply
introduction to econometrics
Husseini Reply
Hi
mostafa
hi
LEMLEM
hello
Sammol
hi
Mahesh
bi
Ruqayat
hi
Ruqayat
Hi fellas
Nyawa
hey
Sammol
hi
God
hello
Jahara
Good morning
Jorge
hi
abubakar
hi
Nmesoma
hi
Mahesh
Hi
Tom
Why is unemployment rate never zero at full employment?
Priyanka Reply
bcoz of existence of frictional unemployment in our economy.
Umashankar
what is flexible exchang rate?
poudel
due to existence of the pple with disabilities
Abdulraufu
the demand of a good rises, causing the demand for another good to fall
Rushawn Reply
is it possible to leave every good at the same level
Joseph
I don't think so. because check it, if the demand for chicken increases, people will no longer consume fish like they used to causing a fall in the demand for fish
Anuolu
is not really possible to let the value of a goods to be same at the same time.....
Salome
Suppose the inflation rate is 6%, does it mean that all the goods you purchase will cost 6% more than previous year? Provide with reasoning.
Geetha Reply
Not necessarily. To measure the inflation rate economists normally use an averaged price index of a basket of certain goods. So if you purchase goods included in the basket, you will notice that you pay 6% more, otherwise not necessarily.
Waeth
discus major problems of macroeconomics
Alii Reply
what is the problem of macroeconomics
Yoal
Economic growth Stable prices and low unemployment
Ephraim
explain inflationcause and itis degre
Miresa Reply
what is inflation
Getu
increase in general price levels
WEETO
Good day How do I calculate this question: C= 100+5yd G= 2000 T= 2000 I(planned)=200. Suppose the actual output is 3000. What is the level of planned expenditures at this level of output?
Chisomo Reply
how to calculate actual output?
Chisomo
how to calculate the equilibrium income
Beshir
Criteria for determining money supply
Thapase Reply
who we can define macroeconomics in one line
Muhammad
Aggregate demand
Mohammed
C=k100 +9y and i=k50.calculate the equilibrium level of output
Mercy Reply
Hi
Isiaka
Hi
Geli
hy
Man
👋
Bahunda
hy how are you?
Man
ys
Amisha
how are you guys
Sekou
f9 guys
Amisha
how are you guys
Sekou
ys am also fine
Amisha
fine and you guys
Geli
from Nepal
Amisha
nawalparasi district from belatari
Amisha
nd u
Amisha
I am Camara from Guinea west Africa... happy to meet you guys here
Sekou
ma management ho
Amisha
ahile becheclor ho
Amisha
hjr ktm bta ho ani k kaam grnu hunxa tw
Amisha
belatari
Amisha
1st year ho
Amisha
nd u
Amisha
ahh
Amisha
kaha biratnagar
Amisha
ys
Amisha
kina k vo
Amisha
money as unit of account means what?
Kalombe
A unit of account is something that can be used to value goods and services and make calculations
Jim
all of you please speak in English I can't understand you're language
Muhammad
I want to know how can we define macroeconomics in one line
Muhammad
it must be .9 or 0.9 no Mpc is greater than 1 Y=100+.9Y+50 Y-.9Y=150 0.1Y/0.1=150/0.1 Y=1500
Kalombe
Mercy is it clear?😋
Kalombe
hi can someone help me on this question If a negative shocks shifts the IS curve to the left, what type of policy do you suggest so as to stabilize the level of output? discuss your answer using appropriate graph.
Galge Reply
if interest rate is increased this will will reduce the level of income shifting the curve to the left ◀️
Kalombe
Got questions? Join the online conversation and get instant answers!
Jobilize.com Reply

Get Jobilize Job Search Mobile App in your pocket Now!

Get it on Google Play Download on the App Store Now


Source:  OpenStax, Chemistry. OpenStax CNX. May 20, 2015 Download for free at http://legacy.cnx.org/content/col11760/1.9
Google Play and the Google Play logo are trademarks of Google Inc.

Notification Switch

Would you like to follow the 'Chemistry' conversation and receive update notifications?

Ask