<< Chapter < Page Chapter >> Page >
By the end of this section, you will be able to:
  • Identify the mathematical relationships between the various properties of gases
  • Use the ideal gas law, and related gas laws, to compute the values of various gas properties under specified conditions

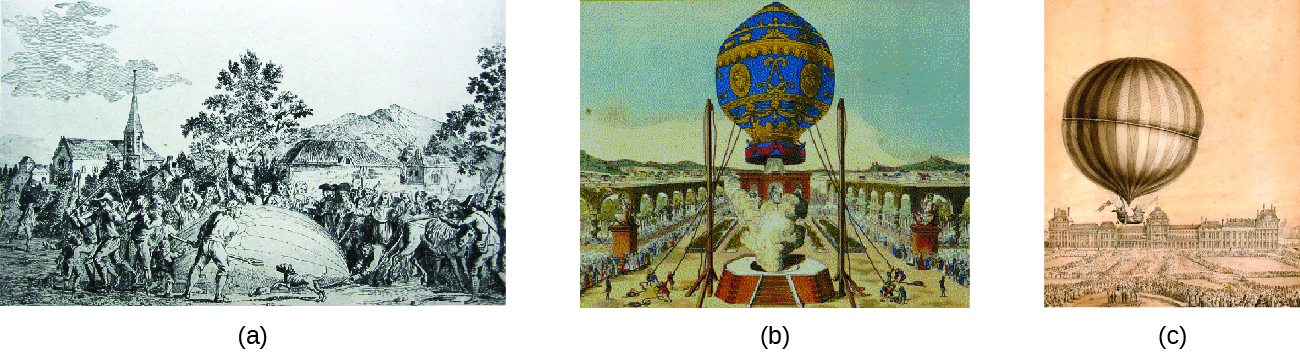
During the seventeenth and especially eighteenth centuries, driven both by a desire to understand nature and a quest to make balloons in which they could fly ( [link] ), a number of scientists established the relationships between the macroscopic physical properties of gases, that is, pressure, volume, temperature, and amount of gas. Although their measurements were not precise by today’s standards, they were able to determine the mathematical relationships between pairs of these variables (e.g., pressure and temperature, pressure and volume) that hold for an ideal gas—a hypothetical construct that real gases approximate under certain conditions. Eventually, these individual laws were combined into a single equation—the ideal gas law —that relates gas quantities for gases and is quite accurate for low pressures and moderate temperatures. We will consider the key developments in individual relationships (for pedagogical reasons not quite in historical order), then put them together in the ideal gas law.

This figure includes three images. Image a is a black and white image of a hydrogen balloon apparently being deflated by a mob of people. In image b, a blue, gold, and red balloon is being held to the ground with ropes while positioned above a platform from which smoke is rising beneath the balloon. In c, an image is shown in grey on a peach-colored background of an inflated balloon with vertical striping in the air. It appears to have a basket attached to its lower side. A large stately building appears in the background.
In 1783, the first (a) hydrogen-filled balloon flight, (b) manned hot air balloon flight, and (c) manned hydrogen-filled balloon flight occurred. When the hydrogen-filled balloon depicted in (a) landed, the frightened villagers of Gonesse reportedly destroyed it with pitchforks and knives. The launch of the latter was reportedly viewed by 400,000 people in Paris.

Pressure and temperature: amontons’s law

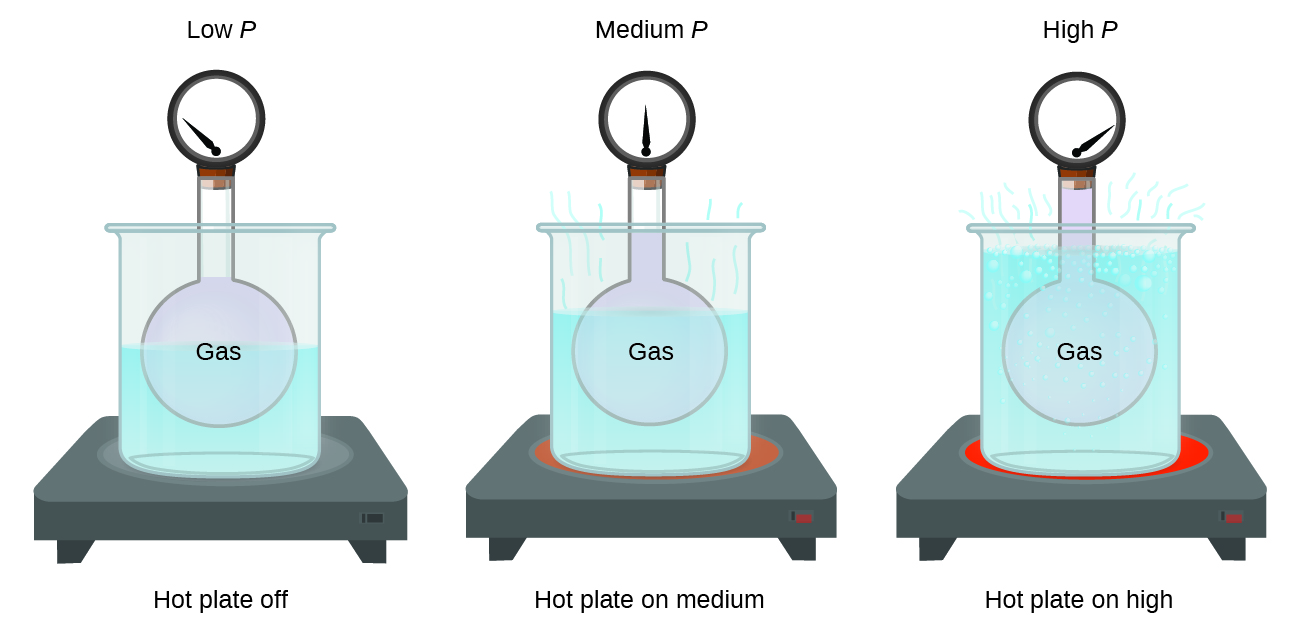
Imagine filling a rigid container attached to a pressure gauge with gas and then sealing the container so that no gas may escape. If the container is cooled, the gas inside likewise gets colder and its pressure is observed to decrease. Since the container is rigid and tightly sealed, both the volume and number of moles of gas remain constant. If we heat the sphere, the gas inside gets hotter ( [link] ) and the pressure increases.

This figure includes three similar diagrams. In the first diagram to the left, a rigid spherical container of a gas to which a pressure gauge is attached at the top is placed in a large beaker of water, indicated in light blue, atop a hot plate. The needle on the pressure gauge points to the far left on the gauge. The diagram is labeled “low P” above and “hot plate off” below. The second similar diagram also has the rigid spherical container of gas placed in a large beaker from which light blue wavy line segments extend from the top of the liquid in the beaker. The beaker is situated on top of a slightly reddened circular area. The needle on the pressure gauge points straight up, or to the middle on the gauge. The diagram is labeled “medium P” above and “hot plate on medium” below. The third diagram also has the rigid spherical container of gas placed in a large beaker in which bubbles appear near the liquid surface and several wavy light blue line segments extend from the surface out of the beaker. The beaker is situated on top of a bright red circular area. The needle on the pressure gauge points to the far right on the gauge. The diagram is labeled “high P” above and “hot plate on high” below.
The effect of temperature on gas pressure: When the hot plate is off, the pressure of the gas in the sphere is relatively low. As the gas is heated, the pressure of the gas in the sphere increases.

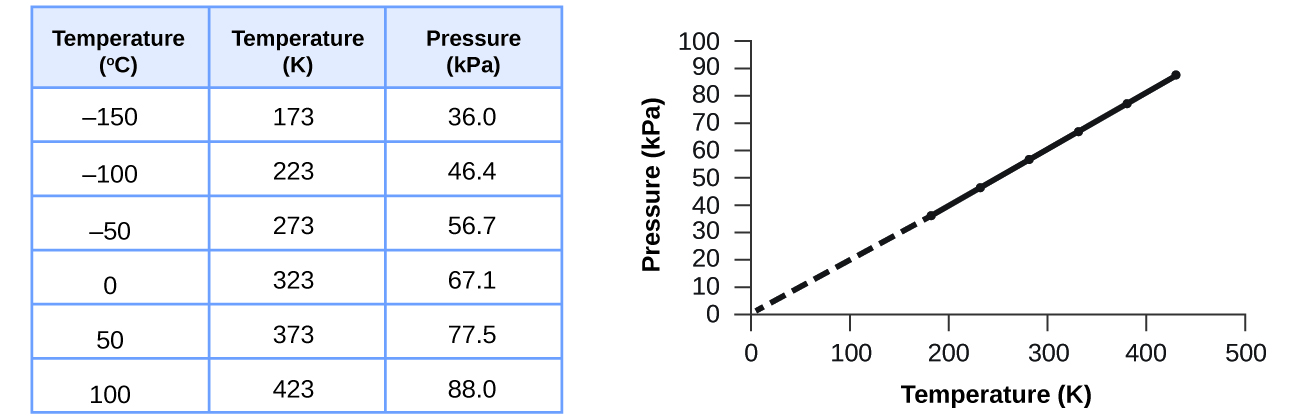
This relationship between temperature and pressure is observed for any sample of gas confined to a constant volume. An example of experimental pressure-temperature data is shown for a sample of air under these conditions in [link] . We find that temperature and pressure are linearly related, and if the temperature is on the kelvin scale, then P and T are directly proportional (again, when volume and moles of gas are held constant ); if the temperature on the kelvin scale increases by a certain factor, the gas pressure increases by the same factor.

This figure includes a table and a graph. The table has 3 columns and 7 rows. The first row is a header, which labels the columns “Temperature, degrees C,” “Temperature, K,” and “Pressure, k P a.” The first column contains the values from top to bottom negative 150, negative 100, negative 50, 0, 50, and 100. The second column contains the values from top to bottom 173, 223, 273, 323, 373, and 423. The third column contains the values 36.0, 46.4, 56.7, 67.1, 77.5, and 88.0. A graph appears to the right of the table. The horizontal axis is labeled “Temperature ( K ).” with markings and labels provided for multiples of 100 beginning at 0 and ending at 500. The vertical axis is labeled “Pressure ( k P a )” with markings and labels provided for multiples of 10, beginning at 0 and ending at 100. Six data points from the table are plotted on the graph with black dots. These dots are connected with a solid black line. A dashed line extends from the data point furthest to the left to the origin. The graph shows a positive linear trend.
For a constant volume and amount of air, the pressure and temperature are directly proportional, provided the temperature is in kelvin. (Measurements cannot be made at lower temperatures because of the condensation of the gas.) When this line is extrapolated to lower pressures, it reaches a pressure of 0 at –273 °C, which is 0 on the kelvin scale and the lowest possible temperature, called absolute zero.

Questions & Answers

differentiate between demand and supply giving examples
Lambiv Reply
differentiated between demand and supply using examples
Lambiv
what is labour ?
Lambiv
how will I do?
Venny Reply
how is the graph works?I don't fully understand
Rezat Reply
information
Eliyee
devaluation
Eliyee
t
WARKISA
hi guys good evening to all
Lambiv
multiple choice question
Aster Reply
appreciation
Eliyee
explain perfect market
Lindiwe Reply
In economics, a perfect market refers to a theoretical construct where all participants have perfect information, goods are homogenous, there are no barriers to entry or exit, and prices are determined solely by supply and demand. It's an idealized model used for analysis,
Ezea
What is ceteris paribus?
Shukri Reply
other things being equal
AI-Robot
When MP₁ becomes negative, TP start to decline. Extuples Suppose that the short-run production function of certain cut-flower firm is given by: Q=4KL-0.6K2 - 0.112 • Where is quantity of cut flower produced, I is labour input and K is fixed capital input (K-5). Determine the average product of lab
Kelo
Extuples Suppose that the short-run production function of certain cut-flower firm is given by: Q=4KL-0.6K2 - 0.112 • Where is quantity of cut flower produced, I is labour input and K is fixed capital input (K-5). Determine the average product of labour (APL) and marginal product of labour (MPL)
Kelo
yes,thank you
Shukri
Can I ask you other question?
Shukri
what is monopoly mean?
Habtamu Reply
What is different between quantity demand and demand?
Shukri Reply
Quantity demanded refers to the specific amount of a good or service that consumers are willing and able to purchase at a give price and within a specific time period. Demand, on the other hand, is a broader concept that encompasses the entire relationship between price and quantity demanded
Ezea
ok
Shukri
how do you save a country economic situation when it's falling apart
Lilia Reply
what is the difference between economic growth and development
Fiker Reply
Economic growth as an increase in the production and consumption of goods and services within an economy.but Economic development as a broader concept that encompasses not only economic growth but also social & human well being.
Shukri
production function means
Jabir
What do you think is more important to focus on when considering inequality ?
Abdisa Reply
any question about economics?
Awais Reply
sir...I just want to ask one question... Define the term contract curve? if you are free please help me to find this answer 🙏
Asui
it is a curve that we get after connecting the pareto optimal combinations of two consumers after their mutually beneficial trade offs
Awais
thank you so much 👍 sir
Asui
In economics, the contract curve refers to the set of points in an Edgeworth box diagram where both parties involved in a trade cannot be made better off without making one of them worse off. It represents the Pareto efficient allocations of goods between two individuals or entities, where neither p
Cornelius
In economics, the contract curve refers to the set of points in an Edgeworth box diagram where both parties involved in a trade cannot be made better off without making one of them worse off. It represents the Pareto efficient allocations of goods between two individuals or entities,
Cornelius
Suppose a consumer consuming two commodities X and Y has The following utility function u=X0.4 Y0.6. If the price of the X and Y are 2 and 3 respectively and income Constraint is birr 50. A,Calculate quantities of x and y which maximize utility. B,Calculate value of Lagrange multiplier. C,Calculate quantities of X and Y consumed with a given price. D,alculate optimum level of output .
Feyisa Reply
Answer
Feyisa
c
Jabir
the market for lemon has 10 potential consumers, each having an individual demand curve p=101-10Qi, where p is price in dollar's per cup and Qi is the number of cups demanded per week by the i th consumer.Find the market demand curve using algebra. Draw an individual demand curve and the market dema
Gsbwnw Reply
suppose the production function is given by ( L, K)=L¼K¾.assuming capital is fixed find APL and MPL. consider the following short run production function:Q=6L²-0.4L³ a) find the value of L that maximizes output b)find the value of L that maximizes marginal product
Abdureman
types of unemployment
Yomi Reply
What is the difference between perfect competition and monopolistic competition?
Mohammed
Got questions? Join the online conversation and get instant answers!
Jobilize.com Reply

Get Jobilize Job Search Mobile App in your pocket Now!

Get it on Google Play Download on the App Store Now


Source:  OpenStax, Chemistry. OpenStax CNX. May 20, 2015 Download for free at http://legacy.cnx.org/content/col11760/1.9
Google Play and the Google Play logo are trademarks of Google Inc.

Notification Switch

Would you like to follow the 'Chemistry' conversation and receive update notifications?

Ask