<< Chapter < Page Chapter >> Page >
By the end of this section, you will be able to:
  • Derive the predicted ground-state electron configurations of atoms
  • Identify and explain exceptions to predicted electron configurations for atoms and ions
  • Relate electron configurations to element classifications in the periodic table

Having introduced the basics of atomic structure and quantum mechanics, we can use our understanding of quantum numbers to determine how atomic orbitals relate to one another. This allows us to determine which orbitals are occupied by electrons in each atom. The specific arrangement of electrons in orbitals of an atom determines many of the chemical properties of that atom.

Orbital energies and atomic structure

The energy of atomic orbitals increases as the principal quantum number, n , increases. In any atom with two or more electrons, the repulsion between the electrons makes energies of subshells with different values of l differ so that the energy of the orbitals increases within a shell in the order s < p < d < f. [link] depicts how these two trends in increasing energy relate. The 1 s orbital at the bottom of the diagram is the orbital with electrons of lowest energy. The energy increases as we move up to the 2 s and then 2 p , 3 s , and 3 p orbitals, showing that the increasing n value has more influence on energy than the increasing l value for small atoms. However, this pattern does not hold for larger atoms. The 3 d orbital is higher in energy than the 4 s orbital. Such overlaps continue to occur frequently as we move up the chart.

A table entitled, “Subshell electron capacity,” is shown. Along the left side of the table, an upward pointing arrow labeled, “E,” is drawn. The table includes three columns. The first column is narrow and is labeled, “2.” The second is slightly wider and is labeled, “6.” The third is slightly wider yet and is labeled, “10.” The fourth is the widest and is labeled, “14.” The first column begins at the very bottom with a horizontal line segment labeled “1 s.” Evenly spaced line segments continue up to 7 s near the top of the column. In the second column, a horizontal dashed line segment labeled, “2 p,” appears at a level between the 2 s and 3 s levels. Similarly 3 p appears at a level between 3 s and 4 s, 4 p appears just below 5 s, 5 p appears just below 6 s, and 6 p appears just below 7 s. In the third column, a dashed line labeled, “3 d,” appears just below the level of 4 p. Similarly, 4 d appears just below 5 p and 5 d appears just below 6 p. Six d however appears above the levels of both 6 p and 7 s. The far right column entries begin with a dashed line labeled, “4 f,” positioned at a level just below 5 d. Similarly, a second dashed line segment appears just below the level of 6 d, which is labeled, “5 f.”
Generalized energy-level diagram for atomic orbitals in an atom with two or more electrons (not to scale).

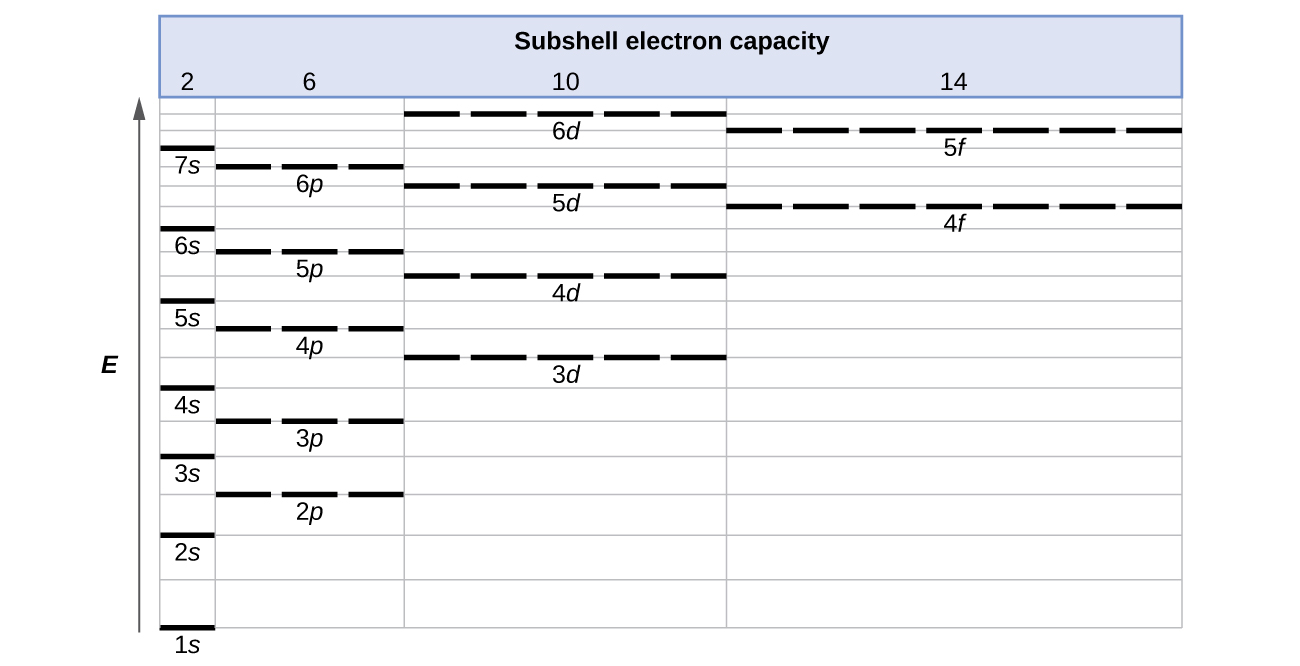
Electrons in successive atoms on the periodic table tend to fill low-energy orbitals first. Thus, many students find it confusing that, for example, the 5 p orbitals fill immediately after the 4 d , and immediately before the 6 s . The filling order is based on observed experimental results, and has been confirmed by theoretical calculations. As the principal quantum number, n , increases, the size of the orbital increases and the electrons spend more time farther from the nucleus. Thus, the attraction to the nucleus is weaker and the energy associated with the orbital is higher (less stabilized). But this is not the only effect we have to take into account. Within each shell, as the value of l increases, the electrons are less penetrating (meaning there is less electron density found close to the nucleus), in the order s > p > d > f . Electrons that are closer to the nucleus slightly repel electrons that are farther out, offsetting the more dominant electron–nucleus attractions slightly (recall that all electrons have −1 charges, but nuclei have + Z charges). This phenomenon is called shielding and will be discussed in more detail in the next section. Electrons in orbitals that experience more shielding are less stabilized and thus higher in energy. For small orbitals (1 s through 3 p ), the increase in energy due to n is more significant than the increase due to l ; however, for larger orbitals the two trends are comparable and cannot be simply predicted. We will discuss methods for remembering the observed order.

Questions & Answers

Ayele, K., 2003. Introductory Economics, 3rd ed., Addis Ababa.
Widad Reply
can you send the book attached ?
Ariel
?
Ariel
What is economics
Widad Reply
the study of how humans make choices under conditions of scarcity
AI-Robot
U(x,y) = (x×y)1/2 find mu of x for y
Desalegn Reply
U(x,y) = (x×y)1/2 find mu of x for y
Desalegn
what is ecnomics
Jan Reply
this is the study of how the society manages it's scarce resources
Belonwu
what is macroeconomic
John Reply
macroeconomic is the branch of economics which studies actions, scale, activities and behaviour of the aggregate economy as a whole.
husaini
etc
husaini
difference between firm and industry
husaini Reply
what's the difference between a firm and an industry
Abdul
firm is the unit which transform inputs to output where as industry contain combination of firms with similar production 😅😅
Abdulraufu
Suppose the demand function that a firm faces shifted from Qd  120 3P to Qd  90  3P and the supply function has shifted from QS  20  2P to QS 10  2P . a) Find the effect of this change on price and quantity. b) Which of the changes in demand and supply is higher?
Toofiq Reply
explain standard reason why economic is a science
innocent Reply
factors influencing supply
Petrus Reply
what is economic.
Milan Reply
scares means__________________ends resources. unlimited
Jan
economics is a science that studies human behaviour as a relationship b/w ends and scares means which have alternative uses
Jan
calculate the profit maximizing for demand and supply
Zarshad Reply
Why qualify 28 supplies
Milan
what are explicit costs
Nomsa Reply
out-of-pocket costs for a firm, for example, payments for wages and salaries, rent, or materials
AI-Robot
concepts of supply in microeconomics
David Reply
economic overview notes
Amahle Reply
identify a demand and a supply curve
Salome Reply
i don't know
Parul
there's a difference
Aryan
Demand curve shows that how supply and others conditions affect on demand of a particular thing and what percent demand increase whith increase of supply of goods
Israr
Hi Sir please how do u calculate Cross elastic demand and income elastic demand?
Abari
Got questions? Join the online conversation and get instant answers!
Jobilize.com Reply
Practice Key Terms 7

Get Jobilize Job Search Mobile App in your pocket Now!

Get it on Google Play Download on the App Store Now


Source:  OpenStax, Chemistry. OpenStax CNX. May 20, 2015 Download for free at http://legacy.cnx.org/content/col11760/1.9
Google Play and the Google Play logo are trademarks of Google Inc.

Notification Switch

Would you like to follow the 'Chemistry' conversation and receive update notifications?

Ask