<< Chapter < Page Chapter >> Page >
By the end of this section, you will be able to:
  • Derive the predicted ground-state electron configurations of atoms
  • Identify and explain exceptions to predicted electron configurations for atoms and ions
  • Relate electron configurations to element classifications in the periodic table

Having introduced the basics of atomic structure and quantum mechanics, we can use our understanding of quantum numbers to determine how atomic orbitals relate to one another. This allows us to determine which orbitals are occupied by electrons in each atom. The specific arrangement of electrons in orbitals of an atom determines many of the chemical properties of that atom.

Orbital energies and atomic structure

The energy of atomic orbitals increases as the principal quantum number, n , increases. In any atom with two or more electrons, the repulsion between the electrons makes energies of subshells with different values of l differ so that the energy of the orbitals increases within a shell in the order s < p < d < f. [link] depicts how these two trends in increasing energy relate. The 1 s orbital at the bottom of the diagram is the orbital with electrons of lowest energy. The energy increases as we move up to the 2 s and then 2 p , 3 s , and 3 p orbitals, showing that the increasing n value has more influence on energy than the increasing l value for small atoms. However, this pattern does not hold for larger atoms. The 3 d orbital is higher in energy than the 4 s orbital. Such overlaps continue to occur frequently as we move up the chart.
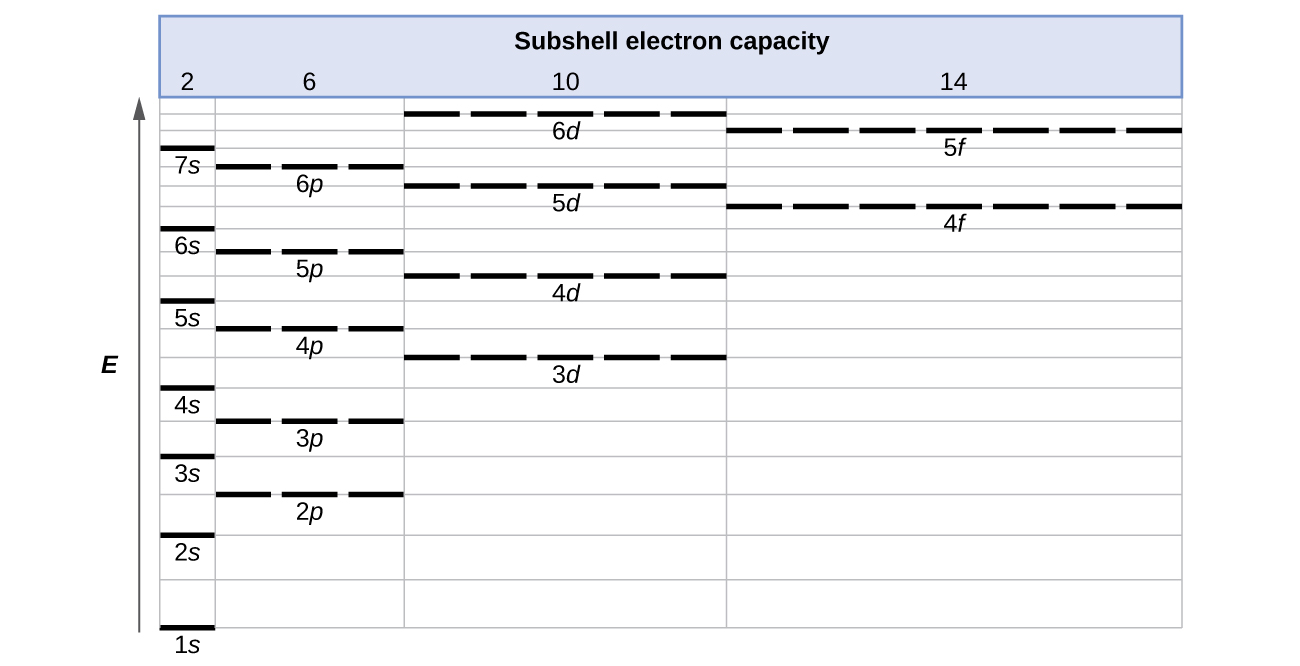
A table entitled, “Subshell electron capacity,” is shown. Along the left side of the table, an upward pointing arrow labeled, “E,” is drawn. The table includes three columns. The first column is narrow and is labeled, “2.” The second is slightly wider and is labeled, “6.” The third is slightly wider yet and is labeled, “10.” The fourth is the widest and is labeled, “14.” The first column begins at the very bottom with a horizontal line segment labeled “1 s.” Evenly spaced line segments continue up to 7 s near the top of the column. In the second column, a horizontal dashed line segment labeled, “2 p,” appears at a level between the 2 s and 3 s levels. Similarly 3 p appears at a level between 3 s and 4 s, 4 p appears just below 5 s, 5 p appears just below 6 s, and 6 p appears just below 7 s. In the third column, a dashed line labeled, “3 d,” appears just below the level of 4 p. Similarly, 4 d appears just below 5 p and 5 d appears just below 6 p. Six d however appears above the levels of both 6 p and 7 s. The far right column entries begin with a dashed line labeled, “4 f,” positioned at a level just below 5 d. Similarly, a second dashed line segment appears just below the level of 6 d, which is labeled, “5 f.”
Generalized energy-level diagram for atomic orbitals in an atom with two or more electrons (not to scale).

Electrons in successive atoms on the periodic table tend to fill low-energy orbitals first. Thus, many students find it confusing that, for example, the 5 p orbitals fill immediately after the 4 d , and immediately before the 6 s . The filling order is based on observed experimental results, and has been confirmed by theoretical calculations. As the principal quantum number, n , increases, the size of the orbital increases and the electrons spend more time farther from the nucleus. Thus, the attraction to the nucleus is weaker and the energy associated with the orbital is higher (less stabilized). But this is not the only effect we have to take into account. Within each shell, as the value of l increases, the electrons are less penetrating (meaning there is less electron density found close to the nucleus), in the order s > p > d > f . Electrons that are closer to the nucleus slightly repel electrons that are farther out, offsetting the more dominant electron–nucleus attractions slightly (recall that all electrons have −1 charges, but nuclei have + Z charges). This phenomenon is called shielding and will be discussed in more detail in the next section. Electrons in orbitals that experience more shielding are less stabilized and thus higher in energy. For small orbitals (1 s through 3 p ), the increase in energy due to n is more significant than the increase due to l ; however, for larger orbitals the two trends are comparable and cannot be simply predicted. We will discuss methods for remembering the observed order.

Questions & Answers

how do you get the 2/50
Abba Reply
number of sport play by 50 student construct discrete data
Aminu Reply
width of the frangebany leaves on how to write a introduction
Theresa Reply
Solve the mean of variance
Veronica Reply
Step 1: Find the mean. To find the mean, add up all the scores, then divide them by the number of scores. ... Step 2: Find each score's deviation from the mean. ... Step 3: Square each deviation from the mean. ... Step 4: Find the sum of squares. ... Step 5: Divide the sum of squares by n – 1 or N.
kenneth
what is error
Yakuba Reply
Is mistake done to something
Vutshila
Hy
anas
hy
What is the life teble
anas
hy
Jibrin
statistics is the analyzing of data
Tajudeen Reply
what is statics?
Zelalem Reply
how do you calculate mean
Gloria Reply
diveving the sum if all values
Shaynaynay
let A1,A2 and A3 events be independent,show that (A1)^c, (A2)^c and (A3)^c are independent?
Fisaye Reply
what is statistics
Akhisani Reply
data collected all over the world
Shaynaynay
construct a less than and more than table
Imad Reply
The sample of 16 students is taken. The average age in the sample was 22 years with astandard deviation of 6 years. Construct a 95% confidence interval for the age of the population.
Aschalew Reply
Bhartdarshan' is an internet-based travel agency wherein customer can see videos of the cities they plant to visit. The number of hits daily is a normally distributed random variable with a mean of 10,000 and a standard deviation of 2,400 a. what is the probability of getting more than 12,000 hits? b. what is the probability of getting fewer than 9,000 hits?
Akshay Reply
Bhartdarshan'is an internet-based travel agency wherein customer can see videos of the cities they plan to visit. The number of hits daily is a normally distributed random variable with a mean of 10,000 and a standard deviation of 2,400. a. What is the probability of getting more than 12,000 hits
Akshay
1
Bright
Sorry i want to learn more about this question
Bright
Someone help
Bright
a= 0.20233 b=0.3384
Sufiyan
a
Shaynaynay
How do I interpret level of significance?
Mohd Reply
It depends on your business problem or in Machine Learning you could use ROC- AUC cruve to decide the threshold value
Shivam
how skewness and kurtosis are used in statistics
Owen Reply
yes what is it
Taneeya
Got questions? Join the online conversation and get instant answers!
Jobilize.com Reply
Practice Key Terms 7

Get Jobilize Job Search Mobile App in your pocket Now!

Get it on Google Play Download on the App Store Now


Source:  OpenStax, Chemistry. OpenStax CNX. May 20, 2015 Download for free at http://legacy.cnx.org/content/col11760/1.9
Google Play and the Google Play logo are trademarks of Google Inc.

Notification Switch

Would you like to follow the 'Chemistry' conversation and receive update notifications?

Ask