<< Chapter < Page Chapter >> Page >

Hydrogen bonding

Nitrosyl fluoride (ONF, molecular mass 49 amu) is a gas at room temperature. Water (H 2 O, molecular mass 18 amu) is a liquid, even though it has a lower molecular mass. We clearly cannot attribute this difference between the two compounds to dispersion forces. Both molecules have about the same shape and ONF is the heavier and larger molecule. It is, therefore, expected to experience more significant dispersion forces. Additionally, we cannot attribute this difference in boiling points to differences in the dipole moments of the molecules. Both molecules are polar and exhibit comparable dipole moments. The large difference between the boiling points is due to a particularly strong dipole-dipole attraction that may occur when a molecule contains a hydrogen atom bonded to a fluorine, oxygen, or nitrogen atom (the three most electronegative elements). The very large difference in electronegativity between the H atom (2.1) and the atom to which it is bonded (4.0 for an F atom, 3.5 for an O atom, or 3.0 for a N atom), combined with the very small size of a H atom and the relatively small sizes of F, O, or N atoms, leads to highly concentrated partial charges with these atoms. Molecules with F-H, O-H, or N-H moieties are very strongly attracted to similar moieties in nearby molecules, a particularly strong type of dipole-dipole attraction called hydrogen bonding    . Examples of hydrogen bonds include HF⋯HF, H 2 O⋯HOH, and H 3 N⋯HNH 2 , in which the hydrogen bonds are denoted by dots. [link] illustrates hydrogen bonding between water molecules.

Five water molecules are shown near one another, but not touching. A dotted line lies between many of the hydrogen atoms on one molecule and the oxygen atom on another molecule.
Water molecules participate in multiple hydrogen-bonding interactions with nearby water molecules.

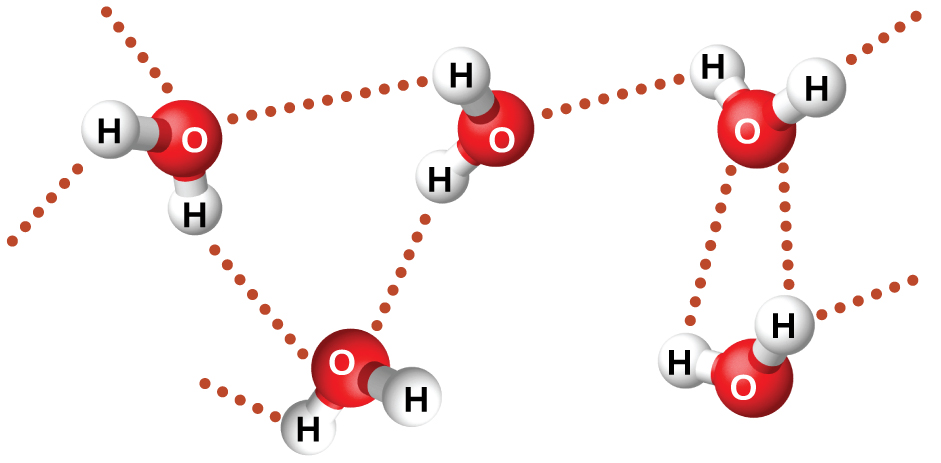
Despite use of the word “bond,” keep in mind that hydrogen bonds are intermolecular attractive forces, not intramolecular attractive forces (covalent bonds). Hydrogen bonds are much weaker than covalent bonds, only about 5 to 10% as strong, but are generally much stronger than other dipole-dipole attractions and dispersion forces.

Hydrogen bonds have a pronounced effect on the properties of condensed phases (liquids and solids). For example, consider the trends in boiling points for the binary hydrides of group 15 (NH 3 , PH 3 , AsH 3 , and SbH 3 ), group 16 hydrides (H 2 O, H 2 S, H 2 Se, and H 2 Te), and group 17 hydrides (HF, HCl, HBr, and HI). The boiling points of the heaviest three hydrides for each group are plotted in [link] . As we progress down any of these groups, the polarities of the molecules decrease slightly, whereas the sizes of the molecules increase substantially. The effect of increasingly stronger dispersion forces dominates that of increasingly weaker dipole-dipole attractions, and the boiling points are observed to increase steadily.

A line graph is shown where the y-axis is labeled “Boiling point (, degree sign, C )” and has values of “ negative 150” to “150” from bottom to top in increments of 50. The x-axis is labeled “Period” and has values of “0” to “5” in increments of 1. Three lines are shown on the graph and are labeled in the legend. The red line is labeled as “halogen family,” the blue is “oxygen family” and the green is “nitrogen family.” The first point on the red line is labeled “question mark” and is at point “2, negative 120”. The second point on the line is labeled “H C l” and is at point “3, negative 80” while the third point on the line is labeled “H B r” and is at point “4, negative 60”. The fourth point on the line is labeled “H I” and is at point “5, negative 40.” The first point on the green line is labeled “question mark” and is at point “2, negative 125.” The second point on the line is labeled “P H, subscript 3” and is at point “3, negative 80” while the third point on the line is labeled “A s H, subscript 3” and is at point “4, negative 55.” The fourth point on the line is labeled “S b H, subscript 3” and is at point “5, negative 10.” The first point on the blue line is labeled “question mark” and is at point “2, negative 80.” The second point on the line is labeled “H, subscript 2, S” and is at point “3, negative 55” while the third point on the line is labeled “H, subscript 2, S e” and is at point “4, negative 45.” The fourth point on the line is labeled “H, subscript 2, T e” and is at point “5, negative 3.”
For the group 15, 16, and 17 hydrides, the boiling points for each class of compounds increase with increasing molecular mass for elements in periods 3, 4, and 5.

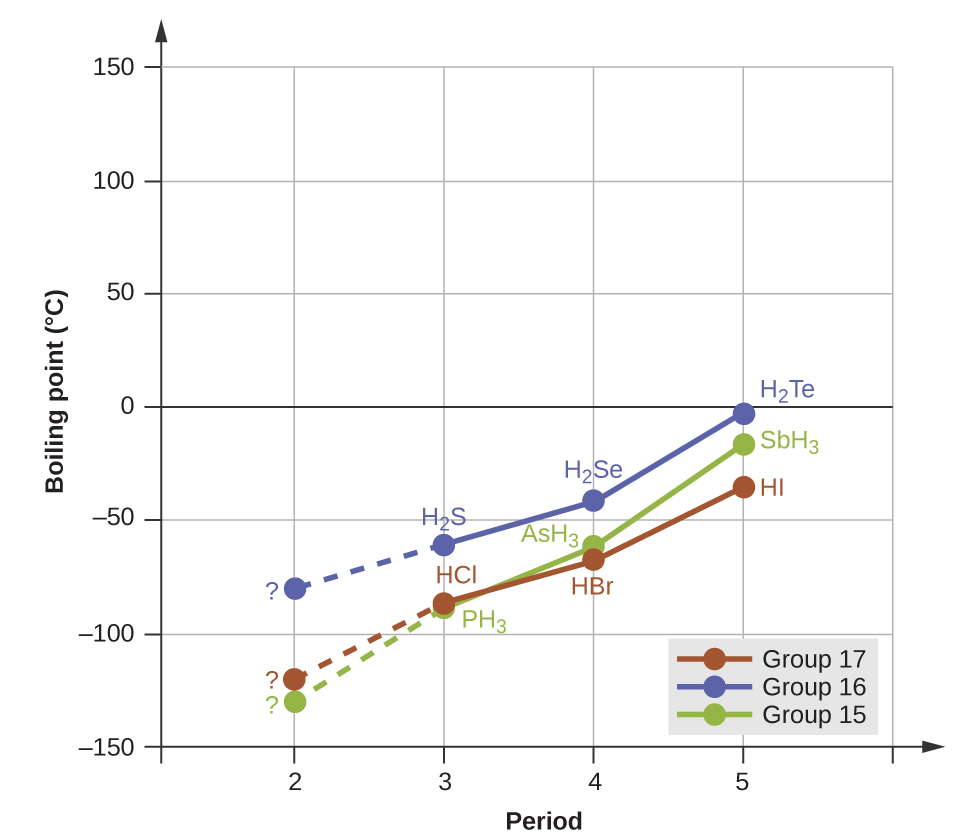
If we use this trend to predict the boiling points for the lightest hydride for each group, we would expect NH 3 to boil at about −120 °C, H 2 O to boil at about −80 °C, and HF to boil at about −110 °C. However, when we measure the boiling points for these compounds, we find that they are dramatically higher than the trends would predict, as shown in [link] . The stark contrast between our naïve predictions and reality provides compelling evidence for the strength of hydrogen bonding.

Questions & Answers

differentiate between demand and supply giving examples
Lambiv Reply
differentiated between demand and supply using examples
Lambiv
what is labour ?
Lambiv
how will I do?
Venny Reply
how is the graph works?I don't fully understand
Rezat Reply
information
Eliyee
devaluation
Eliyee
t
WARKISA
hi guys good evening to all
Lambiv
multiple choice question
Aster Reply
appreciation
Eliyee
explain perfect market
Lindiwe Reply
In economics, a perfect market refers to a theoretical construct where all participants have perfect information, goods are homogenous, there are no barriers to entry or exit, and prices are determined solely by supply and demand. It's an idealized model used for analysis,
Ezea
What is ceteris paribus?
Shukri Reply
other things being equal
AI-Robot
When MP₁ becomes negative, TP start to decline. Extuples Suppose that the short-run production function of certain cut-flower firm is given by: Q=4KL-0.6K2 - 0.112 • Where is quantity of cut flower produced, I is labour input and K is fixed capital input (K-5). Determine the average product of lab
Kelo
Extuples Suppose that the short-run production function of certain cut-flower firm is given by: Q=4KL-0.6K2 - 0.112 • Where is quantity of cut flower produced, I is labour input and K is fixed capital input (K-5). Determine the average product of labour (APL) and marginal product of labour (MPL)
Kelo
yes,thank you
Shukri
Can I ask you other question?
Shukri
what is monopoly mean?
Habtamu Reply
What is different between quantity demand and demand?
Shukri Reply
Quantity demanded refers to the specific amount of a good or service that consumers are willing and able to purchase at a give price and within a specific time period. Demand, on the other hand, is a broader concept that encompasses the entire relationship between price and quantity demanded
Ezea
ok
Shukri
how do you save a country economic situation when it's falling apart
Lilia Reply
what is the difference between economic growth and development
Fiker Reply
Economic growth as an increase in the production and consumption of goods and services within an economy.but Economic development as a broader concept that encompasses not only economic growth but also social & human well being.
Shukri
production function means
Jabir
What do you think is more important to focus on when considering inequality ?
Abdisa Reply
any question about economics?
Awais Reply
sir...I just want to ask one question... Define the term contract curve? if you are free please help me to find this answer 🙏
Asui
it is a curve that we get after connecting the pareto optimal combinations of two consumers after their mutually beneficial trade offs
Awais
thank you so much 👍 sir
Asui
In economics, the contract curve refers to the set of points in an Edgeworth box diagram where both parties involved in a trade cannot be made better off without making one of them worse off. It represents the Pareto efficient allocations of goods between two individuals or entities, where neither p
Cornelius
In economics, the contract curve refers to the set of points in an Edgeworth box diagram where both parties involved in a trade cannot be made better off without making one of them worse off. It represents the Pareto efficient allocations of goods between two individuals or entities,
Cornelius
Suppose a consumer consuming two commodities X and Y has The following utility function u=X0.4 Y0.6. If the price of the X and Y are 2 and 3 respectively and income Constraint is birr 50. A,Calculate quantities of x and y which maximize utility. B,Calculate value of Lagrange multiplier. C,Calculate quantities of X and Y consumed with a given price. D,alculate optimum level of output .
Feyisa Reply
Answer
Feyisa
c
Jabir
the market for lemon has 10 potential consumers, each having an individual demand curve p=101-10Qi, where p is price in dollar's per cup and Qi is the number of cups demanded per week by the i th consumer.Find the market demand curve using algebra. Draw an individual demand curve and the market dema
Gsbwnw Reply
suppose the production function is given by ( L, K)=L¼K¾.assuming capital is fixed find APL and MPL. consider the following short run production function:Q=6L²-0.4L³ a) find the value of L that maximizes output b)find the value of L that maximizes marginal product
Abdureman
types of unemployment
Yomi Reply
What is the difference between perfect competition and monopolistic competition?
Mohammed
Got questions? Join the online conversation and get instant answers!
Jobilize.com Reply
Practice Key Terms 8

Get Jobilize Job Search Mobile App in your pocket Now!

Get it on Google Play Download on the App Store Now


Source:  OpenStax, Chemistry. OpenStax CNX. May 20, 2015 Download for free at http://legacy.cnx.org/content/col11760/1.9
Google Play and the Google Play logo are trademarks of Google Inc.

Notification Switch

Would you like to follow the 'Chemistry' conversation and receive update notifications?

Ask