<< Chapter < Page Chapter >> Page >
Two pictures are shown. In a, a person is shown pouring a liquid from a small beaker into a buret. The person is wearing goggles and gloves as she transfers the solution into the buret. In b, a close up view of the markings on the side of the buret is shown. The markings for 10, 15, and 20 are clearly shown with horizontal rings printed on the buret. Between each of these whole number markings, half markings are also clearly shown with horizontal line segment markings.
(a) A student fills a buret in preparation for a titration analysis. (b) A typical buret permits volume measurements to the nearest 0.1 mL. (credit a: modification of work by Mark Blaser and Matt Evans; credit b: modification of work by Mark Blaser and Matt Evans)

Titration analysis

The end point in a titration of a 50.00-mL sample of aqueous HCl was reached by addition of 35.23 mL of 0.250 M NaOH titrant. The titration reaction is:

HCl ( a q ) + NaOH ( a q ) NaCl ( a q ) + H 2 O ( l )

What is the molarity of the HCl?

Solution

As for all reaction stoichiometry calculations, the key issue is the relation between the molar amounts of the chemical species of interest as depicted in the balanced chemical equation. The approach outlined in previous modules of this chapter is followed, with additional considerations required, since the amounts of reactants provided and requested are expressed as solution concentrations.

For this exercise, the calculation will follow the following outlined steps:

This figure shows four rectangles. The first is shaded lavender and is labeled, “Volume of N a O H.” This rectangle is followed by an arrow pointing right which is labeled, “Molar concentration,” to a second rectangle. This second rectangle is shaded pink and is labeled, “Moles of N a O H.” This rectangle is followed by an arrow pointing right which is labeled, “Stoichiometric factor,” to a third rectangle which is shaded pink and is labeled, “Moles of H C l.” This rectangle is followed by an arrow labeled, “Solution volume,” which points right to a fourth rectangle. This fourth rectangle is shaded lavender and is labeled, “Concentration of H C l.”

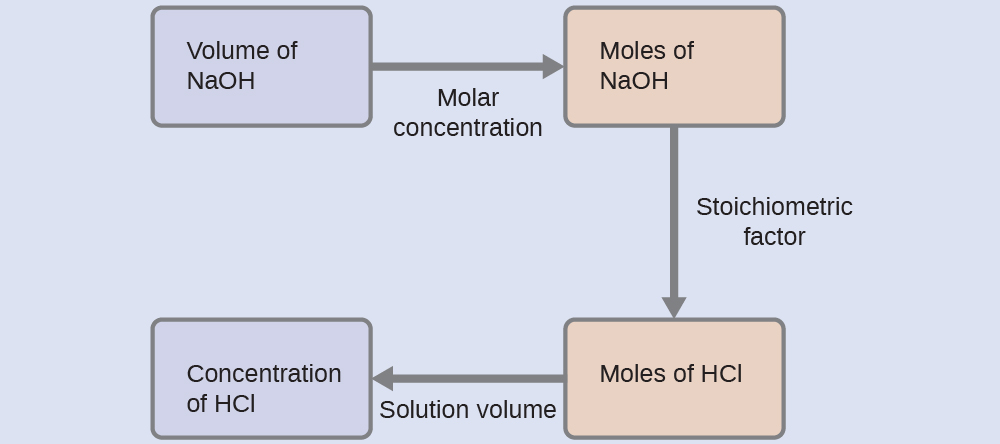
The molar amount of HCl is calculated to be:

35.23 mL NaOH × 1 L 1000 mL × 0.250 mol NaOH 1 L × 1 mol HCl 1 mol NaOH = 8.81 × 10 −3 mol HCl

Using the provided volume of HCl solution and the definition of molarity, the HCl concentration is:

M = mol HCl L solution M = 8.81 × 10 −3 mol HCl 50.00 mL × 1 L 1000 mL M = 0.176 M

Note: For these types of titration calculations, it is convenient to recognize that solution molarity is also equal to the number of milli moles of solute per milli liter of solution:

M = mol solute L solution × 10 3 mmol mol 10 3 mL L = mmol solute mL solution

Using this version of the molarity unit will shorten the calculation by eliminating two conversion factors:

35.23 mL NaOH × 0.250 mmol NaOH mL NaOH × 1 mmol HCl 1 mmol NaOH 50.00 mL solution = 0.176 M HCl

Check your learning

A 20.00-mL sample of aqueous oxalic acid, H 2 C 2 O 4 , was titrated with a 0.09113- M solution of potassium permanganate.

2MnO 4 ( a q ) + 5 H 2 C 2 O 4 ( a q ) + 6 H + ( a q ) 10 CO 2 ( g ) + 2 Mn 2+ ( a q ) + 8 H 2 O ( l )

A volume of 23.24 mL was required to reach the end point. What is the oxalic acid molarity?

Answer:

0.2648 M

Got questions? Get instant answers now!

Gravimetric analysis

A gravimetric analysis    is one in which a sample is subjected to some treatment that causes a change in the physical state of the analyte that permits its separation from the other components of the sample. Mass measurements of the sample, the isolated analyte, or some other component of the analysis system, used along with the known stoichiometry of the compounds involved, permit calculation of the analyte concentration. Gravimetric methods were the first techniques used for quantitative chemical analysis, and they remain important tools in the modern chemistry laboratory.

The required change of state in a gravimetric analysis may be achieved by various physical and chemical processes. For example, the moisture (water) content of a sample is routinely determined by measuring the mass of a sample before and after it is subjected to a controlled heating process that evaporates the water. Also common are gravimetric techniques in which the analyte is subjected to a precipitation reaction of the sort described earlier in this chapter. The precipitate is typically isolated from the reaction mixture by filtration, carefully dried, and then weighed ( [link] ). The mass of the precipitate may then be used, along with relevant stoichiometric relationships, to calculate analyte concentration.

Questions & Answers

differentiate between demand and supply giving examples
Lambiv Reply
differentiated between demand and supply using examples
Lambiv
what is labour ?
Lambiv
how will I do?
Venny Reply
how is the graph works?I don't fully understand
Rezat Reply
information
Eliyee
devaluation
Eliyee
t
WARKISA
hi guys good evening to all
Lambiv
multiple choice question
Aster Reply
appreciation
Eliyee
explain perfect market
Lindiwe Reply
In economics, a perfect market refers to a theoretical construct where all participants have perfect information, goods are homogenous, there are no barriers to entry or exit, and prices are determined solely by supply and demand. It's an idealized model used for analysis,
Ezea
What is ceteris paribus?
Shukri Reply
other things being equal
AI-Robot
When MP₁ becomes negative, TP start to decline. Extuples Suppose that the short-run production function of certain cut-flower firm is given by: Q=4KL-0.6K2 - 0.112 • Where is quantity of cut flower produced, I is labour input and K is fixed capital input (K-5). Determine the average product of lab
Kelo
Extuples Suppose that the short-run production function of certain cut-flower firm is given by: Q=4KL-0.6K2 - 0.112 • Where is quantity of cut flower produced, I is labour input and K is fixed capital input (K-5). Determine the average product of labour (APL) and marginal product of labour (MPL)
Kelo
yes,thank you
Shukri
Can I ask you other question?
Shukri
what is monopoly mean?
Habtamu Reply
What is different between quantity demand and demand?
Shukri Reply
Quantity demanded refers to the specific amount of a good or service that consumers are willing and able to purchase at a give price and within a specific time period. Demand, on the other hand, is a broader concept that encompasses the entire relationship between price and quantity demanded
Ezea
ok
Shukri
how do you save a country economic situation when it's falling apart
Lilia Reply
what is the difference between economic growth and development
Fiker Reply
Economic growth as an increase in the production and consumption of goods and services within an economy.but Economic development as a broader concept that encompasses not only economic growth but also social & human well being.
Shukri
production function means
Jabir
What do you think is more important to focus on when considering inequality ?
Abdisa Reply
any question about economics?
Awais Reply
sir...I just want to ask one question... Define the term contract curve? if you are free please help me to find this answer 🙏
Asui
it is a curve that we get after connecting the pareto optimal combinations of two consumers after their mutually beneficial trade offs
Awais
thank you so much 👍 sir
Asui
In economics, the contract curve refers to the set of points in an Edgeworth box diagram where both parties involved in a trade cannot be made better off without making one of them worse off. It represents the Pareto efficient allocations of goods between two individuals or entities, where neither p
Cornelius
In economics, the contract curve refers to the set of points in an Edgeworth box diagram where both parties involved in a trade cannot be made better off without making one of them worse off. It represents the Pareto efficient allocations of goods between two individuals or entities,
Cornelius
Suppose a consumer consuming two commodities X and Y has The following utility function u=X0.4 Y0.6. If the price of the X and Y are 2 and 3 respectively and income Constraint is birr 50. A,Calculate quantities of x and y which maximize utility. B,Calculate value of Lagrange multiplier. C,Calculate quantities of X and Y consumed with a given price. D,alculate optimum level of output .
Feyisa Reply
Answer
Feyisa
c
Jabir
the market for lemon has 10 potential consumers, each having an individual demand curve p=101-10Qi, where p is price in dollar's per cup and Qi is the number of cups demanded per week by the i th consumer.Find the market demand curve using algebra. Draw an individual demand curve and the market dema
Gsbwnw Reply
suppose the production function is given by ( L, K)=L¼K¾.assuming capital is fixed find APL and MPL. consider the following short run production function:Q=6L²-0.4L³ a) find the value of L that maximizes output b)find the value of L that maximizes marginal product
Abdureman
types of unemployment
Yomi Reply
What is the difference between perfect competition and monopolistic competition?
Mohammed
Got questions? Join the online conversation and get instant answers!
Jobilize.com Reply

Get Jobilize Job Search Mobile App in your pocket Now!

Get it on Google Play Download on the App Store Now


Source:  OpenStax, Chemistry. OpenStax CNX. May 20, 2015 Download for free at http://legacy.cnx.org/content/col11760/1.9
Google Play and the Google Play logo are trademarks of Google Inc.

Notification Switch

Would you like to follow the 'Chemistry' conversation and receive update notifications?

Ask