<< Chapter < Page Chapter >> Page >
The images are shown and labeled “a,” “b” and “c.” Image a, labeled “Sub-critical mass,” shows a blue circle background with a white sphere near the outer, top, left edge of the circle. A downward, right-facing arrow indicates that the white sphere enters the circle. Seven small, yellow starbursts are drawn in the blue circle and each has an arrow facing from it to outside the circle, in seemingly random directions. Image b, labeled “Critical mass,” shows a blue circle background with a white sphere near the outer, top, left edge of the circle. A downward, right-facing arrow indicates that the white sphere enters the circle. Seventeen small, yellow starbursts are drawn in the blue circle and each has an arrow facing from it to outside the circle, in seemingly random directions. Image c, labeled “Critical mass from neutron deflection,” shows a blue circle background, lying in a larger purple circle, with a white sphere near the outer, top, left edge of the purple circle. A downward, right-facing arrow indicates that the white sphere enters both of the circles. Thirteen small, yellow starbursts are drawn in the blue circle and each has an arrow facing from it to outside the blue circle, and a couple outside of the purple circle, in seemingly random directions.
(a) In a subcritical mass, the fissile material is too small and allows too many neutrons to escape the material, so a chain reaction does not occur. (b) In a critical mass, a large enough number of neutrons in the fissile material induce fission to create a chain reaction.

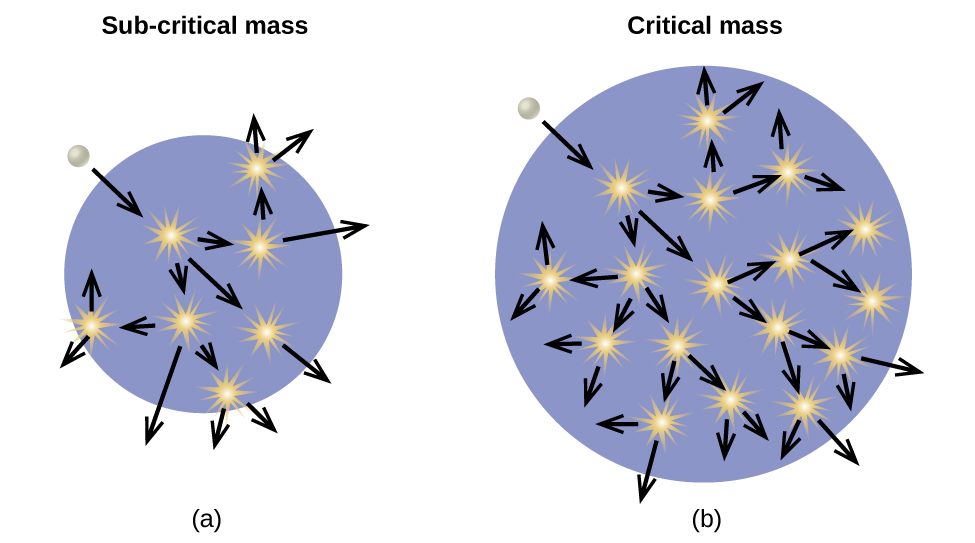
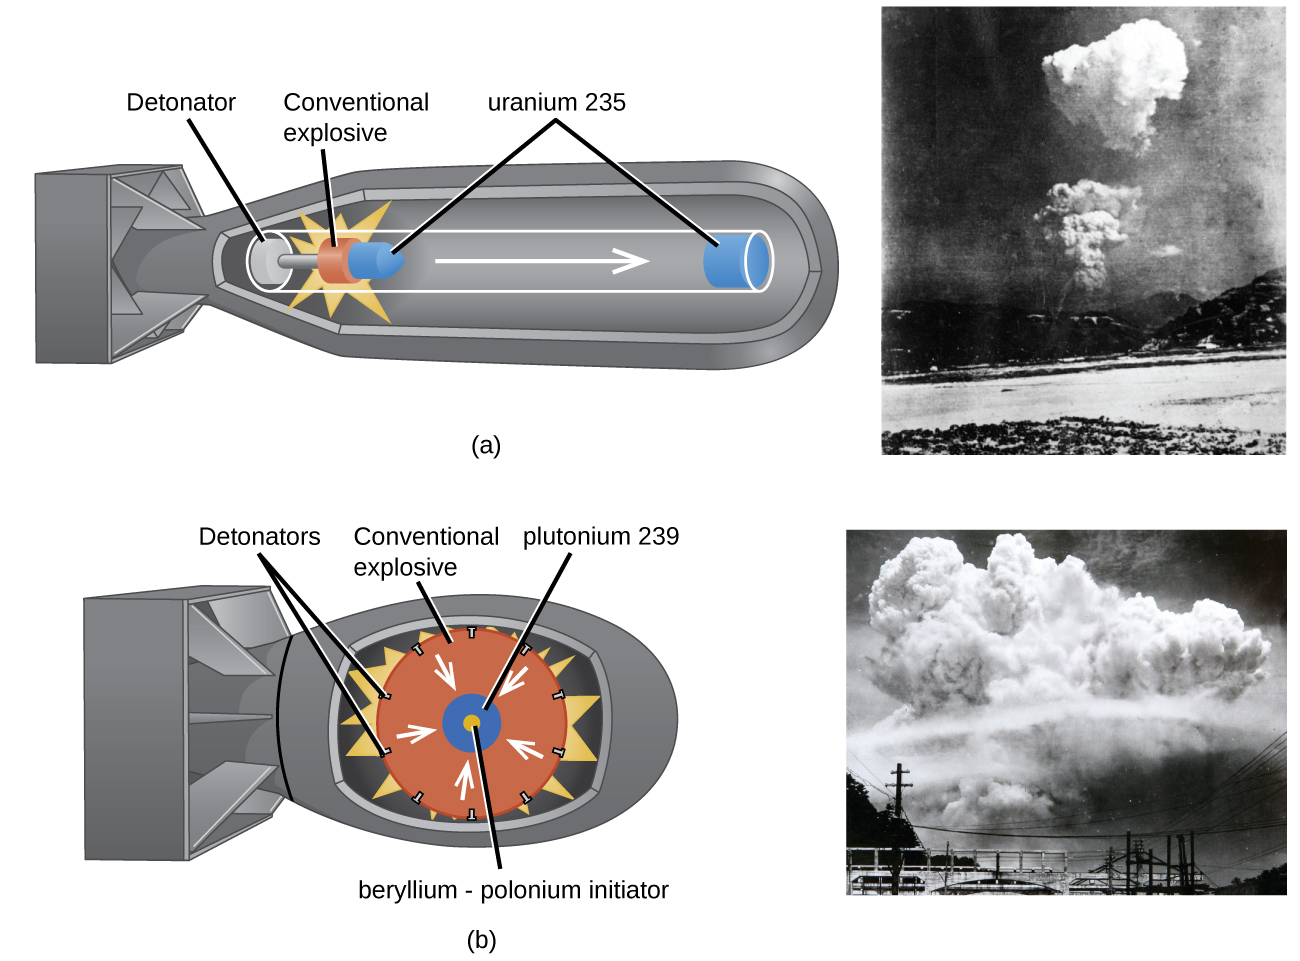
An atomic bomb ( [link] ) contains several pounds of fissionable material, 92 235 U or 94 239 Pu , a source of neutrons, and an explosive device for compressing it quickly into a small volume. When fissionable material is in small pieces, the proportion of neutrons that escape through the relatively large surface area is great, and a chain reaction does not take place. When the small pieces of fissionable material are brought together quickly to form a body with a mass larger than the critical mass, the relative number of escaping neutrons decreases, and a chain reaction and explosion result.

Two diagrams are shown, each to the left of a photo, and labeled “a” and “b.” Diagram a shows the outer casing of a bomb that has a long, tubular shape with a squared-off tail. Components in the shell show a tube with a white disk labeled “Detonator” on the left, an orange disk with a bright yellow starburst drawn around it labeled “Conventional explosive” in the middle and a right-facing arrow leading to a blue disk in the nose of the bomb labeled “uranium 235.” A small blue cone next to the orange disk is shares the label of “uranium 235.” A black and white photo next to this diagram shows a far-off shot of a rising cloud over a landscape. Diagram b shows the outer casing of a bomb that has a short, rounded shape with a squared-off tail. Components in the shell show a large orange circle labeled “Conventional explosive” with a series of black dots around its edge, labeled “Detonators,” and a yellow starburst behind it. White arrows face from the outer edge of the orange circle to a blue circle in the center with a yellow core. The blue circle is labeled “plutonium 239” while the yellow core is labeled “beryllium, dash, polonium initiator.” A black and white photo next to this diagram shows a far-off shot of a giant rising cloud over a landscape.
(a) The nuclear fission bomb that destroyed Hiroshima on August 6, 1945, consisted of two subcritical masses of U-235, where conventional explosives were used to fire one of the subcritical masses into the other, creating the critical mass for the nuclear explosion. (b) The plutonium bomb that destroyed Nagasaki on August 12, 1945, consisted of a hollow sphere of plutonium that was rapidly compressed by conventional explosives. This led to a concentration of plutonium in the center that was greater than the critical mass necessary for the nuclear explosion.

Fission reactors

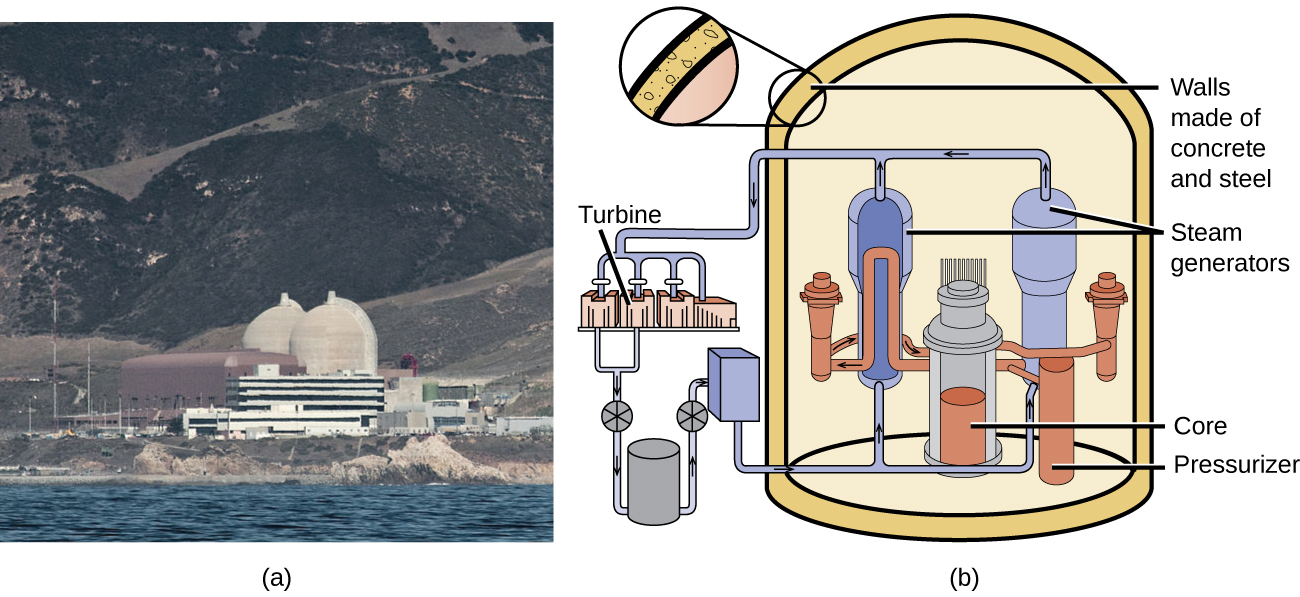
Chain reactions of fissionable materials can be controlled and sustained without an explosion in a nuclear reactor    ( [link] ). Any nuclear reactor that produces power via the fission of uranium or plutonium by bombardment with neutrons must have at least five components: nuclear fuel consisting of fissionable material, a nuclear moderator, reactor coolant, control rods, and a shield and containment system. We will discuss these components in greater detail later in the section. The reactor works by separating the fissionable nuclear material such that a critical mass cannot be formed, controlling both the flux and absorption of neutrons to allow shutting down the fission reactions. In a nuclear reactor used for the production of electricity, the energy released by fission reactions is trapped as thermal energy and used to boil water and produce steam. The steam is used to turn a turbine, which powers a generator for the production of electricity.

A photo labeled “a” and a diagram labeled “b” is shown. The photo is of a power plant with two large white domes and many buildings. The diagram shows a cylindrical container with thick walls labeled “Walls made of concrete and steel” and three main components inside. The first of these components is a pair of tall cylinders labeled “Steam generators” that sit to either side of a shorter cylinder labeled “Core.” Next to the core is a thin cylinder labeled “Pressurizer.” To the left of the outer walls is a set of pistons labeled “Turbines” that sit above a series of other equipment.
(a) The Diablo Canyon Nuclear Power Plant near San Luis Obispo is the only nuclear power plant currently in operation in California. The domes are the containment structures for the nuclear reactors, and the brown building houses the turbine where electricity is generated. Ocean water is used for cooling. (b) The Diablo Canyon uses a pressurized water reactor, one of a few different fission reactor designs in use around the world, to produce electricity. Energy from the nuclear fission reactions in the core heats water in a closed, pressurized system. Heat from this system produces steam that drives a turbine, which in turn produces electricity. (credit a: modification of work by “Mike” Michael L. Baird; credit b: modification of work by the Nuclear Regulatory Commission)

Questions & Answers

differentiate between demand and supply giving examples
Lambiv Reply
differentiated between demand and supply using examples
Lambiv
what is labour ?
Lambiv
how will I do?
Venny Reply
how is the graph works?I don't fully understand
Rezat Reply
information
Eliyee
devaluation
Eliyee
t
WARKISA
hi guys good evening to all
Lambiv
multiple choice question
Aster Reply
appreciation
Eliyee
explain perfect market
Lindiwe Reply
In economics, a perfect market refers to a theoretical construct where all participants have perfect information, goods are homogenous, there are no barriers to entry or exit, and prices are determined solely by supply and demand. It's an idealized model used for analysis,
Ezea
What is ceteris paribus?
Shukri Reply
other things being equal
AI-Robot
When MP₁ becomes negative, TP start to decline. Extuples Suppose that the short-run production function of certain cut-flower firm is given by: Q=4KL-0.6K2 - 0.112 • Where is quantity of cut flower produced, I is labour input and K is fixed capital input (K-5). Determine the average product of lab
Kelo
Extuples Suppose that the short-run production function of certain cut-flower firm is given by: Q=4KL-0.6K2 - 0.112 • Where is quantity of cut flower produced, I is labour input and K is fixed capital input (K-5). Determine the average product of labour (APL) and marginal product of labour (MPL)
Kelo
yes,thank you
Shukri
Can I ask you other question?
Shukri
what is monopoly mean?
Habtamu Reply
What is different between quantity demand and demand?
Shukri Reply
Quantity demanded refers to the specific amount of a good or service that consumers are willing and able to purchase at a give price and within a specific time period. Demand, on the other hand, is a broader concept that encompasses the entire relationship between price and quantity demanded
Ezea
ok
Shukri
how do you save a country economic situation when it's falling apart
Lilia Reply
what is the difference between economic growth and development
Fiker Reply
Economic growth as an increase in the production and consumption of goods and services within an economy.but Economic development as a broader concept that encompasses not only economic growth but also social & human well being.
Shukri
production function means
Jabir
What do you think is more important to focus on when considering inequality ?
Abdisa Reply
any question about economics?
Awais Reply
sir...I just want to ask one question... Define the term contract curve? if you are free please help me to find this answer 🙏
Asui
it is a curve that we get after connecting the pareto optimal combinations of two consumers after their mutually beneficial trade offs
Awais
thank you so much 👍 sir
Asui
In economics, the contract curve refers to the set of points in an Edgeworth box diagram where both parties involved in a trade cannot be made better off without making one of them worse off. It represents the Pareto efficient allocations of goods between two individuals or entities, where neither p
Cornelius
In economics, the contract curve refers to the set of points in an Edgeworth box diagram where both parties involved in a trade cannot be made better off without making one of them worse off. It represents the Pareto efficient allocations of goods between two individuals or entities,
Cornelius
Suppose a consumer consuming two commodities X and Y has The following utility function u=X0.4 Y0.6. If the price of the X and Y are 2 and 3 respectively and income Constraint is birr 50. A,Calculate quantities of x and y which maximize utility. B,Calculate value of Lagrange multiplier. C,Calculate quantities of X and Y consumed with a given price. D,alculate optimum level of output .
Feyisa Reply
Answer
Feyisa
c
Jabir
the market for lemon has 10 potential consumers, each having an individual demand curve p=101-10Qi, where p is price in dollar's per cup and Qi is the number of cups demanded per week by the i th consumer.Find the market demand curve using algebra. Draw an individual demand curve and the market dema
Gsbwnw Reply
suppose the production function is given by ( L, K)=L¼K¾.assuming capital is fixed find APL and MPL. consider the following short run production function:Q=6L²-0.4L³ a) find the value of L that maximizes output b)find the value of L that maximizes marginal product
Abdureman
types of unemployment
Yomi Reply
What is the difference between perfect competition and monopolistic competition?
Mohammed
Got questions? Join the online conversation and get instant answers!
Jobilize.com Reply

Get Jobilize Job Search Mobile App in your pocket Now!

Get it on Google Play Download on the App Store Now


Source:  OpenStax, Chemistry. OpenStax CNX. May 20, 2015 Download for free at http://legacy.cnx.org/content/col11760/1.9
Google Play and the Google Play logo are trademarks of Google Inc.

Notification Switch

Would you like to follow the 'Chemistry' conversation and receive update notifications?

Ask