| << Chapter < Page | Chapter >> Page > |
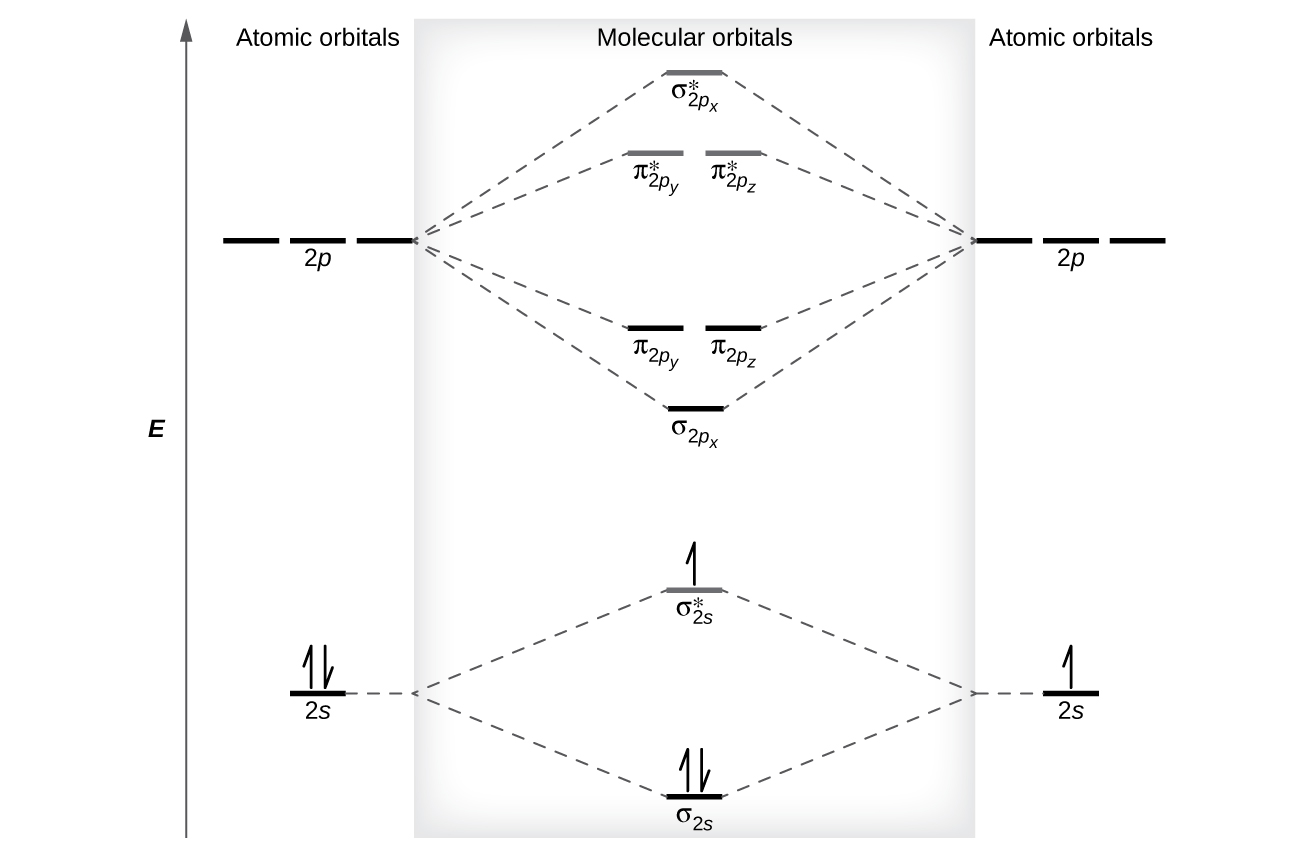
The relative energy levels of atomic and molecular orbitals are typically shown in a molecular orbital diagram ( [link] ). For a diatomic molecule, the atomic orbitals of one atom are shown on the left, and those of the other atom are shown on the right. Each horizontal line represents one orbital that can hold two electrons. The molecular orbitals formed by the combination of the atomic orbitals are shown in the center. Dashed lines show which of the atomic orbitals combine to form the molecular orbitals. For each pair of atomic orbitals that combine, one lower-energy (bonding) molecular orbital and one higher-energy (antibonding) orbital result. Thus we can see that combining the six 2 p atomic orbitals results in three bonding orbitals (one σ and two π) and three antibonding orbitals (one σ* and two π*).
We predict the distribution of electrons in these molecular orbitals by filling the orbitals in the same way that we fill atomic orbitals, by the Aufbau principle. Lower-energy orbitals fill first, electrons spread out among degenerate orbitals before pairing, and each orbital can hold a maximum of two electrons with opposite spins ( [link] ). Just as we write electron configurations for atoms, we can write the molecular electronic configuration by listing the orbitals with superscripts indicating the number of electrons present. For clarity, we place parentheses around molecular orbitals with the same energy. In this case, each orbital is at a different energy, so parentheses separate each orbital. Thus we would expect a diatomic molecule or ion containing seven electrons (such as would have the molecular electron configuration It is common to omit the core electrons from molecular orbital diagrams and configurations and include only the valence electrons.

The filled molecular orbital diagram shows the number of electrons in both bonding and antibonding molecular orbitals. The net contribution of the electrons to the bond strength of a molecule is identified by determining the bond order that results from the filling of the molecular orbitals by electrons.
When using Lewis structures to describe the distribution of electrons in molecules, we define bond order as the number of bonding pairs of electrons between two atoms. Thus a single bond has a bond order of 1, a double bond has a bond order of 2, and a triple bond has a bond order of 3. We define bond order differently when we use the molecular orbital description of the distribution of electrons, but the resulting bond order is usually the same. The MO technique is more accurate and can handle cases when the Lewis structure method fails, but both methods describe the same phenomenon.
In the molecular orbital model, an electron contributes to a bonding interaction if it occupies a bonding orbital and it contributes to an antibonding interaction if it occupies an antibonding orbital. The bond order is calculated by subtracting the destabilizing (antibonding) electrons from the stabilizing (bonding) electrons. Since a bond consists of two electrons, we divide by two to get the bond order. We can determine bond order with the following equation:

Notification Switch
Would you like to follow the 'Chemistry' conversation and receive update notifications?