<< Chapter < Page Chapter >> Page >
By the end of this section, you will be able to:
  • State the periodic law and explain the organization of elements in the periodic table
  • Predict the general properties of elements based on their location within the periodic table
  • Identify metals, nonmetals, and metalloids by their properties and/or location on the periodic table

As early chemists worked to purify ores and discovered more elements, they realized that various elements could be grouped together by their similar chemical behaviors. One such grouping includes lithium (Li), sodium (Na), and potassium (K): These elements all are shiny, conduct heat and electricity well, and have similar chemical properties. A second grouping includes calcium (Ca), strontium (Sr), and barium (Ba), which also are shiny, good conductors of heat and electricity, and have chemical properties in common. However, the specific properties of these two groupings are notably different from each other. For example: Li, Na, and K are much more reactive than are Ca, Sr, and Ba; Li, Na, and K form compounds with oxygen in a ratio of two of their atoms to one oxygen atom, whereas Ca, Sr, and Ba form compounds with one of their atoms to one oxygen atom. Fluorine (F), chlorine (Cl), bromine (Br), and iodine (I) also exhibit similar properties to each other, but these properties are drastically different from those of any of the elements above.

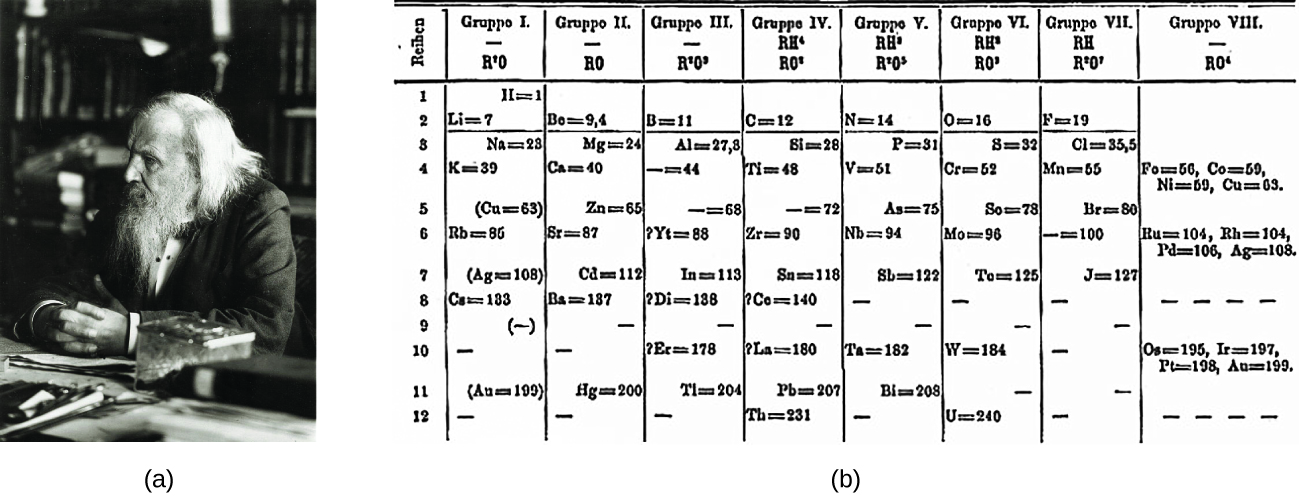
Dimitri Mendeleev in Russia (1869) and Lothar Meyer in Germany (1870) independently recognized that there was a periodic relationship among the properties of the elements known at that time. Both published tables with the elements arranged according to increasing atomic mass. But Mendeleev went one step further than Meyer: He used his table to predict the existence of elements that would have the properties similar to aluminum and silicon, but were yet unknown. The discoveries of gallium (1875) and germanium (1886) provided great support for Mendeleev’s work. Although Mendeleev and Meyer had a long dispute over priority, Mendeleev’s contributions to the development of the periodic table are now more widely recognized ( [link] ).

Figure A shows a photograph of Dimitri Mendeleev. Figure B shows the first periodic table developed by Mendeleev, which had eight groups and twelve periods. In the first group (—, R superscript plus sign 0) is the following information: H = 1, L i = 7, N a = 23, K = 39, (C u = 63), R b = 85, (A g = 108), C a = 183, (—),—, (A u = 199) —. Note that each of these entries corresponds to one of the twelve periods respectively. The second group (—, R 0) contains the following information: (not entry for period 1) B o = 9, 4, M g = 24, C a = 40, Z n = 65, S r = 87, C d = 112, B a = 187, —, —, H g = 200, —. Note the ach of these entries corresponds to one of the twelve periods respectively. Group three (—, R superscript one 0 superscript nine) contains the information: (no entry for period 1), B = 11, A l = 27, 8. — = 44, — = 68, ? Y t = 88, I n = 113, ? D I = 138, —, ? E r = 178, T l = 204, —. Note that each of these entries corresponds to one of the twelve periods respectively. Group four (RH superscript four, R0 superscript eight) contains the following information: (no entry for period 1), C = 12, B i = 28, T i = 48, — = 72, Z r = 90, S n = 118, ? C o = 140, ? L a = 180, P b = 207, T h = 231. Note that each of these entries corresponds to one of the twelve periods respectively. Group five (R H superscript two, R superscript two 0 superscript five) contains the following information: (no entry for period 1), N = 14, P = 31, V = 51, A s = 75, N b = 94, S b = 122, —, —, T a = 182, B l = 208, —. Note that each of these entries corresponds to one of the twelve periods respectively. Group six (R H superscript two, R 0 superscript three) contains the following information: (no entry for period 1), O = 16, S = 32, C r = 52, S o = 78, M o = 96, T o = 125, —, —, W = 184, —, U = 240. Note that each of these entries corresponds to one of the twelve periods respectively. Group seven (R H , R superscript plus sing, 0 superscript 7) contains the following information: (no entry for period 1), F = 19, C l = 35, 5, M n = 55, B r = 80, — = 100, J = 127, —, —, —, —, —. Note that each of these entries corresponds to one of the twelve periods respectively. Group 8 (—, R 0 superscript four) contains the following information: (no entry for periods 1, 2, 3), in period 4: F o = 56, C o = 59, N i = 59, C u = 63, no entry for period five, in period 6: R u = 104, R h = 104, P d = 106, A g = 108, no entries for periods 7, 8 , or 9, in period 10: O s = 195, I r = 197, P t = 198, A u = 199, no entries for periods 11 or 12.
(a) Dimitri Mendeleev is widely credited with creating (b) the first periodic table of the elements. (credit a: modification of work by Serge Lachinov; credit b: modification of work by “Den fjättrade ankan”/Wikimedia Commons)

By the twentieth century, it became apparent that the periodic relationship involved atomic numbers rather than atomic masses. The modern statement of this relationship, the periodic law    , is as follows: the properties of the elements are periodic functions of their atomic numbers . A modern periodic table    arranges the elements in increasing order of their atomic numbers and groups atoms with similar properties in the same vertical column ( [link] ). Each box represents an element and contains its atomic number, symbol, average atomic mass, and (sometimes) name. The elements are arranged in seven horizontal rows, called periods or series    , and 18 vertical columns, called groups . Groups are labeled at the top of each column. In the United States, the labels traditionally were numerals with capital letters. However, IUPAC recommends that the numbers 1 through 18 be used, and these labels are more common. For the table to fit on a single page, parts of two of the rows, a total of 14 columns, are usually written below the main body of the table.

Questions & Answers

it is the relatively stable flow of income
Chidubem Reply
what is circular flow of income
Divine Reply
branches of macroeconomics
SHEDRACK Reply
what is Flexible exchang rate?
poudel Reply
is gdp a reliable measurement of wealth
Atega Reply
introduction to econometrics
Husseini Reply
Hi
mostafa
hi
LEMLEM
hello
Sammol
hi
Mahesh
bi
Ruqayat
hi
Ruqayat
Hi fellas
Nyawa
hey
Sammol
hi
God
hello
Jahara
Good morning
Jorge
hi
abubakar
hi
Nmesoma
hi
Mahesh
Hi
Tom
Why is unemployment rate never zero at full employment?
Priyanka Reply
bcoz of existence of frictional unemployment in our economy.
Umashankar
what is flexible exchang rate?
poudel
due to existence of the pple with disabilities
Abdulraufu
the demand of a good rises, causing the demand for another good to fall
Rushawn Reply
is it possible to leave every good at the same level
Joseph
I don't think so. because check it, if the demand for chicken increases, people will no longer consume fish like they used to causing a fall in the demand for fish
Anuolu
is not really possible to let the value of a goods to be same at the same time.....
Salome
Suppose the inflation rate is 6%, does it mean that all the goods you purchase will cost 6% more than previous year? Provide with reasoning.
Geetha Reply
Not necessarily. To measure the inflation rate economists normally use an averaged price index of a basket of certain goods. So if you purchase goods included in the basket, you will notice that you pay 6% more, otherwise not necessarily.
Waeth
discus major problems of macroeconomics
Alii Reply
what is the problem of macroeconomics
Yoal
Economic growth Stable prices and low unemployment
Ephraim
explain inflationcause and itis degre
Miresa Reply
what is inflation
Getu
increase in general price levels
WEETO
Good day How do I calculate this question: C= 100+5yd G= 2000 T= 2000 I(planned)=200. Suppose the actual output is 3000. What is the level of planned expenditures at this level of output?
Chisomo Reply
how to calculate actual output?
Chisomo
how to calculate the equilibrium income
Beshir
Criteria for determining money supply
Thapase Reply
who we can define macroeconomics in one line
Muhammad
Aggregate demand
Mohammed
C=k100 +9y and i=k50.calculate the equilibrium level of output
Mercy Reply
Hi
Isiaka
Hi
Geli
hy
Man
👋
Bahunda
hy how are you?
Man
ys
Amisha
how are you guys
Sekou
f9 guys
Amisha
how are you guys
Sekou
ys am also fine
Amisha
fine and you guys
Geli
from Nepal
Amisha
nawalparasi district from belatari
Amisha
nd u
Amisha
I am Camara from Guinea west Africa... happy to meet you guys here
Sekou
ma management ho
Amisha
ahile becheclor ho
Amisha
hjr ktm bta ho ani k kaam grnu hunxa tw
Amisha
belatari
Amisha
1st year ho
Amisha
nd u
Amisha
ahh
Amisha
kaha biratnagar
Amisha
ys
Amisha
kina k vo
Amisha
money as unit of account means what?
Kalombe
A unit of account is something that can be used to value goods and services and make calculations
Jim
all of you please speak in English I can't understand you're language
Muhammad
I want to know how can we define macroeconomics in one line
Muhammad
it must be .9 or 0.9 no Mpc is greater than 1 Y=100+.9Y+50 Y-.9Y=150 0.1Y/0.1=150/0.1 Y=1500
Kalombe
Mercy is it clear?😋
Kalombe
hi can someone help me on this question If a negative shocks shifts the IS curve to the left, what type of policy do you suggest so as to stabilize the level of output? discuss your answer using appropriate graph.
Galge Reply
if interest rate is increased this will will reduce the level of income shifting the curve to the left ◀️
Kalombe
Got questions? Join the online conversation and get instant answers!
Jobilize.com Reply

Get Jobilize Job Search Mobile App in your pocket Now!

Get it on Google Play Download on the App Store Now


Source:  OpenStax, Chemistry. OpenStax CNX. May 20, 2015 Download for free at http://legacy.cnx.org/content/col11760/1.9
Google Play and the Google Play logo are trademarks of Google Inc.

Notification Switch

Would you like to follow the 'Chemistry' conversation and receive update notifications?

Ask