<< Chapter < Page Chapter >> Page >
By the end of this section, you will be able to:
  • State the periodic law and explain the organization of elements in the periodic table
  • Predict the general properties of elements based on their location within the periodic table
  • Identify metals, nonmetals, and metalloids by their properties and/or location on the periodic table

As early chemists worked to purify ores and discovered more elements, they realized that various elements could be grouped together by their similar chemical behaviors. One such grouping includes lithium (Li), sodium (Na), and potassium (K): These elements all are shiny, conduct heat and electricity well, and have similar chemical properties. A second grouping includes calcium (Ca), strontium (Sr), and barium (Ba), which also are shiny, good conductors of heat and electricity, and have chemical properties in common. However, the specific properties of these two groupings are notably different from each other. For example: Li, Na, and K are much more reactive than are Ca, Sr, and Ba; Li, Na, and K form compounds with oxygen in a ratio of two of their atoms to one oxygen atom, whereas Ca, Sr, and Ba form compounds with one of their atoms to one oxygen atom. Fluorine (F), chlorine (Cl), bromine (Br), and iodine (I) also exhibit similar properties to each other, but these properties are drastically different from those of any of the elements above.

Dimitri Mendeleev in Russia (1869) and Lothar Meyer in Germany (1870) independently recognized that there was a periodic relationship among the properties of the elements known at that time. Both published tables with the elements arranged according to increasing atomic mass. But Mendeleev went one step further than Meyer: He used his table to predict the existence of elements that would have the properties similar to aluminum and silicon, but were yet unknown. The discoveries of gallium (1875) and germanium (1886) provided great support for Mendeleev’s work. Although Mendeleev and Meyer had a long dispute over priority, Mendeleev’s contributions to the development of the periodic table are now more widely recognized ( [link] ).
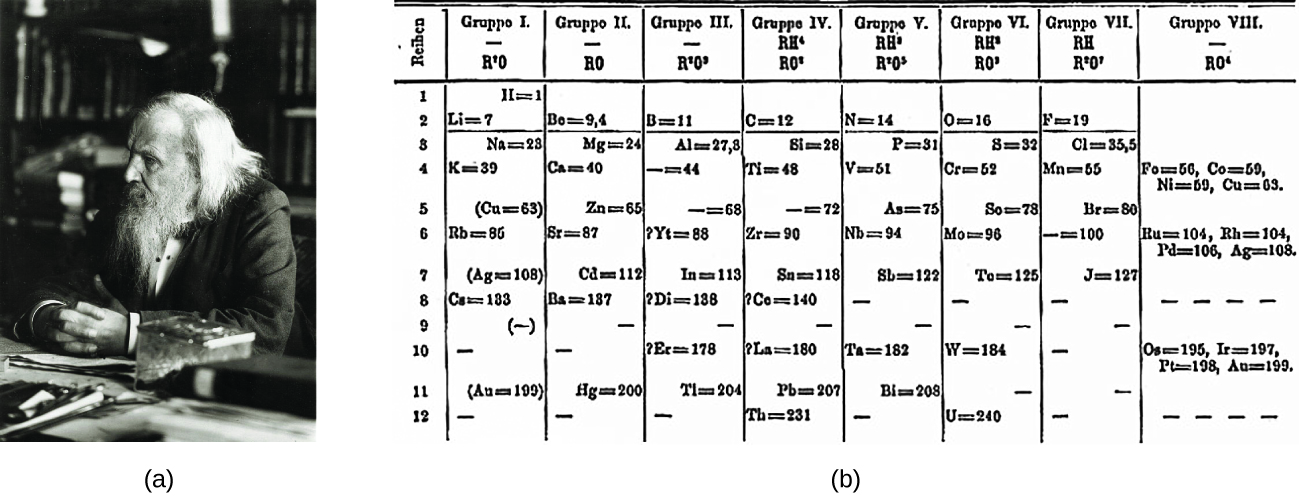
Figure A shows a photograph of Dimitri Mendeleev. Figure B shows the first periodic table developed by Mendeleev, which had eight groups and twelve periods. In the first group (—, R superscript plus sign 0) is the following information: H = 1, L i = 7, N a = 23, K = 39, (C u = 63), R b = 85, (A g = 108), C a = 183, (—),—, (A u = 199) —. Note that each of these entries corresponds to one of the twelve periods respectively. The second group (—, R 0) contains the following information: (not entry for period 1) B o = 9, 4, M g = 24, C a = 40, Z n = 65, S r = 87, C d = 112, B a = 187, —, —, H g = 200, —. Note the ach of these entries corresponds to one of the twelve periods respectively. Group three (—, R superscript one 0 superscript nine) contains the information: (no entry for period 1), B = 11, A l = 27, 8. — = 44, — = 68, ? Y t = 88, I n = 113, ? D I = 138, —, ? E r = 178, T l = 204, —. Note that each of these entries corresponds to one of the twelve periods respectively. Group four (RH superscript four, R0 superscript eight) contains the following information: (no entry for period 1), C = 12, B i = 28, T i = 48, — = 72, Z r = 90, S n = 118, ? C o = 140, ? L a = 180, P b = 207, T h = 231. Note that each of these entries corresponds to one of the twelve periods respectively. Group five (R H superscript two, R superscript two 0 superscript five) contains the following information: (no entry for period 1), N = 14, P = 31, V = 51, A s = 75, N b = 94, S b = 122, —, —, T a = 182, B l = 208, —. Note that each of these entries corresponds to one of the twelve periods respectively. Group six (R H superscript two, R 0 superscript three) contains the following information: (no entry for period 1), O = 16, S = 32, C r = 52, S o = 78, M o = 96, T o = 125, —, —, W = 184, —, U = 240. Note that each of these entries corresponds to one of the twelve periods respectively. Group seven (R H , R superscript plus sing, 0 superscript 7) contains the following information: (no entry for period 1), F = 19, C l = 35, 5, M n = 55, B r = 80, — = 100, J = 127, —, —, —, —, —. Note that each of these entries corresponds to one of the twelve periods respectively. Group 8 (—, R 0 superscript four) contains the following information: (no entry for periods 1, 2, 3), in period 4: F o = 56, C o = 59, N i = 59, C u = 63, no entry for period five, in period 6: R u = 104, R h = 104, P d = 106, A g = 108, no entries for periods 7, 8 , or 9, in period 10: O s = 195, I r = 197, P t = 198, A u = 199, no entries for periods 11 or 12.
(a) Dimitri Mendeleev is widely credited with creating (b) the first periodic table of the elements. (credit a: modification of work by Serge Lachinov; credit b: modification of work by “Den fjättrade ankan”/Wikimedia Commons)

By the twentieth century, it became apparent that the periodic relationship involved atomic numbers rather than atomic masses. The modern statement of this relationship, the periodic law    , is as follows: the properties of the elements are periodic functions of their atomic numbers . A modern periodic table    arranges the elements in increasing order of their atomic numbers and groups atoms with similar properties in the same vertical column ( [link] ). Each box represents an element and contains its atomic number, symbol, average atomic mass, and (sometimes) name. The elements are arranged in seven horizontal rows, called periods or series    , and 18 vertical columns, called groups . Groups are labeled at the top of each column. In the United States, the labels traditionally were numerals with capital letters. However, IUPAC recommends that the numbers 1 through 18 be used, and these labels are more common. For the table to fit on a single page, parts of two of the rows, a total of 14 columns, are usually written below the main body of the table.

Questions & Answers

how do you get the 2/50
Abba Reply
number of sport play by 50 student construct discrete data
Aminu Reply
width of the frangebany leaves on how to write a introduction
Theresa Reply
Solve the mean of variance
Veronica Reply
Step 1: Find the mean. To find the mean, add up all the scores, then divide them by the number of scores. ... Step 2: Find each score's deviation from the mean. ... Step 3: Square each deviation from the mean. ... Step 4: Find the sum of squares. ... Step 5: Divide the sum of squares by n – 1 or N.
kenneth
what is error
Yakuba Reply
Is mistake done to something
Vutshila
Hy
anas
hy
What is the life teble
anas
hy
Jibrin
statistics is the analyzing of data
Tajudeen Reply
what is statics?
Zelalem Reply
how do you calculate mean
Gloria Reply
diveving the sum if all values
Shaynaynay
let A1,A2 and A3 events be independent,show that (A1)^c, (A2)^c and (A3)^c are independent?
Fisaye Reply
what is statistics
Akhisani Reply
data collected all over the world
Shaynaynay
construct a less than and more than table
Imad Reply
The sample of 16 students is taken. The average age in the sample was 22 years with astandard deviation of 6 years. Construct a 95% confidence interval for the age of the population.
Aschalew Reply
Bhartdarshan' is an internet-based travel agency wherein customer can see videos of the cities they plant to visit. The number of hits daily is a normally distributed random variable with a mean of 10,000 and a standard deviation of 2,400 a. what is the probability of getting more than 12,000 hits? b. what is the probability of getting fewer than 9,000 hits?
Akshay Reply
Bhartdarshan'is an internet-based travel agency wherein customer can see videos of the cities they plan to visit. The number of hits daily is a normally distributed random variable with a mean of 10,000 and a standard deviation of 2,400. a. What is the probability of getting more than 12,000 hits
Akshay
1
Bright
Sorry i want to learn more about this question
Bright
Someone help
Bright
a= 0.20233 b=0.3384
Sufiyan
a
Shaynaynay
How do I interpret level of significance?
Mohd Reply
It depends on your business problem or in Machine Learning you could use ROC- AUC cruve to decide the threshold value
Shivam
how skewness and kurtosis are used in statistics
Owen Reply
yes what is it
Taneeya
Got questions? Join the online conversation and get instant answers!
Jobilize.com Reply

Get Jobilize Job Search Mobile App in your pocket Now!

Get it on Google Play Download on the App Store Now


Source:  OpenStax, Chemistry. OpenStax CNX. May 20, 2015 Download for free at http://legacy.cnx.org/content/col11760/1.9
Google Play and the Google Play logo are trademarks of Google Inc.

Notification Switch

Would you like to follow the 'Chemistry' conversation and receive update notifications?

Ask