<< Chapter < Page Chapter >> Page >
By the end of this section, you will be able to:
  • Explain the function of a catalyst in terms of reaction mechanisms and potential energy diagrams
  • List examples of catalysis in natural and industrial processes

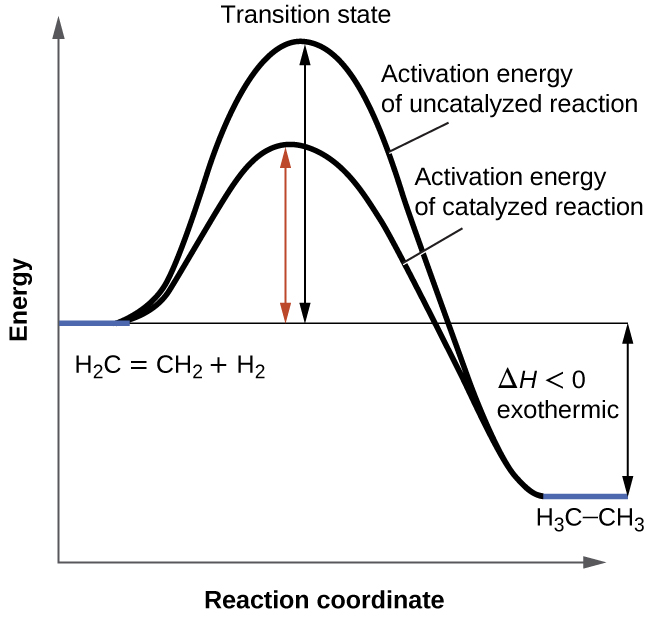
We have seen that the rate of many reactions can be accelerated by catalysts. A catalyst speeds up the rate of a reaction by lowering the activation energy; in addition, the catalyst is regenerated in the process. Several reactions that are thermodynamically favorable in the absence of a catalyst only occur at a reasonable rate when a catalyst is present. One such reaction is catalytic hydrogenation, the process by which hydrogen is added across an alkene C=C bond to afford the saturated alkane product. A comparison of the reaction coordinate diagrams (also known as energy diagrams) for catalyzed and uncatalyzed alkene hydrogenation is shown in [link] .

A graph is shown with the label, “Reaction coordinate,” on the x-axis and the label,“Energy,” on the y-axis. Approximately half-way up the y-axis, a short portion of a black concave down curve which has a horizontal line extended from it across the graph. The left end of this line is labeled “H subscript 2 C equals C H subscript 2 plus H subscript 2.” The black concave down curve extends upward to reach a maximum near the height of the y-axis. The peak of this curve is labeled, “Transition state.” A double sided arrow extends from the horizontal line to the peak of the curve. This arrow is labeled, “Activation energy of Uncatalyzed reation.” From the peak, the curve continues downward to a second horizontally flattened region well below the origin of the curve near the x-axis. This flattened region is shaded in blue and is labeled “H subscript 3 C dash C H subscript 3.” A double sided arrow is drawn from the lowers part of this curve at the far right of the graph to the line extending across the graph above it. This arrow is labeled, “capital delta H less than 0 : exothermic.” A second curve is drawn with the same flattened regions at the start and end of the curve. The height of this curve is about two-thirds the height of the first curve. A double sided arrow is drawn from the horizontal line that originates at the left side of the graph to the peak of this second curve. This arrow is labeled, “Activation energy of catalyzed reaction.”
This graph compares the reaction coordinates for catalyzed and uncatalyzed alkene hydrogenation.

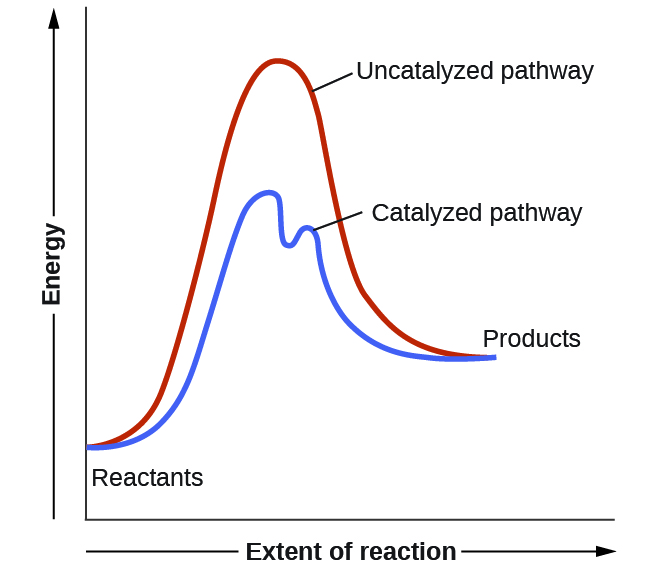
Catalysts function by providing an alternate reaction mechanism that has a lower activation energy than would be found in the absence of the catalyst. In some cases, the catalyzed mechanism may include additional steps, as depicted in the reaction diagrams shown in [link] . This lower activation energy results in an increase in rate as described by the Arrhenius equation. Note that a catalyst decreases the activation energy for both the forward and the reverse reactions and hence accelerates both the forward and the reverse reactions . Consequently, the presence of a catalyst will permit a system to reach equilibrium more quickly, but it has no effect on the position of the equilibrium as reflected in the value of its equilibrium constant (see the later chapter on chemical equilibrium).

A graph is shown with the label, “Extent of reaction,” appearing in a right pointing arrow below the x-axis and the label, “Energy,” in an upward pointing arrow just left of the y-axis. Approximately one-fifth of the way up the y-axis, a very short, somewhat flattened portion of both a red and a blue curve are shown. This region is labeled “Reactants.” A red concave down curve extends upward to reach a maximum near the height of the y-axis. This curve is labeled, “Uncatalyzed pathway.” From the peak, the curve continues downward to a second horizontally flattened region at a height of about one-third the height of the y-axis. This flattened region is labeled, “Products.” A second curve is drawn in blue with the same flattened regions at the start and end of the curve. The height of this curve is about two-thirds the height of the first curve and just right of its maximum, the curve dips low, then rises back and continues a downward trend at a lower height, but similar to that of the red curve. This blue curve is labeled, “Catalyzed pathway.”
This potential energy diagram shows the effect of a catalyst on the activation energy. The catalyst provides a different reaction path with a lower activation energy. As shown, the catalyzed pathway involves a two-step mechanism (note the presence of two transition states) and an intermediate species (represented by the valley between the two transitions states).

Using reaction diagrams to compare catalyzed reactions

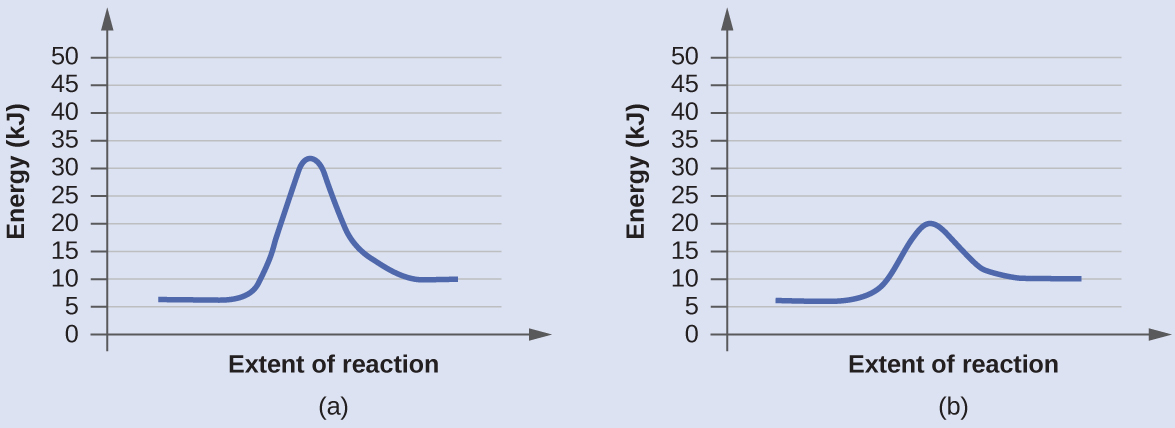
The two reaction diagrams here represent the same reaction: one without a catalyst and one with a catalyst. Identify which diagram suggests the presence of a catalyst, and determine the activation energy for the catalyzed reaction:

In this figure, two graphs are shown. The x-axes are labeled, “Extent of reaction,” and the y-axes are labeled, “Energy ( k J ).” The y-axes are marked off from 0 to 50 in intervals of five. In a, a blue curve is shown. It begins with a horizontal segment at about 6. The curve then rises sharply near the middle to reach a maximum of about 32 and similarly falls to another horizontal segment at about 10. In b, the curve begins and ends similarly, but the maximum reached near the center of the graph is only 20.

Solution

A catalyst does not affect the energy of reactant or product, so those aspects of the diagrams can be ignored; they are, as we would expect, identical in that respect. There is, however, a noticeable difference in the transition state, which is distinctly lower in diagram (b) than it is in (a). This indicates the use of a catalyst in diagram (b). The activation energy is the difference between the energy of the starting reagents and the transition state—a maximum on the reaction coordinate diagram. The reagents are at 6 kJ and the transition state is at 20 kJ, so the activation energy can be calculated as follows:

E a = 20 kJ 6 kJ = 14 kJ

Check your learning

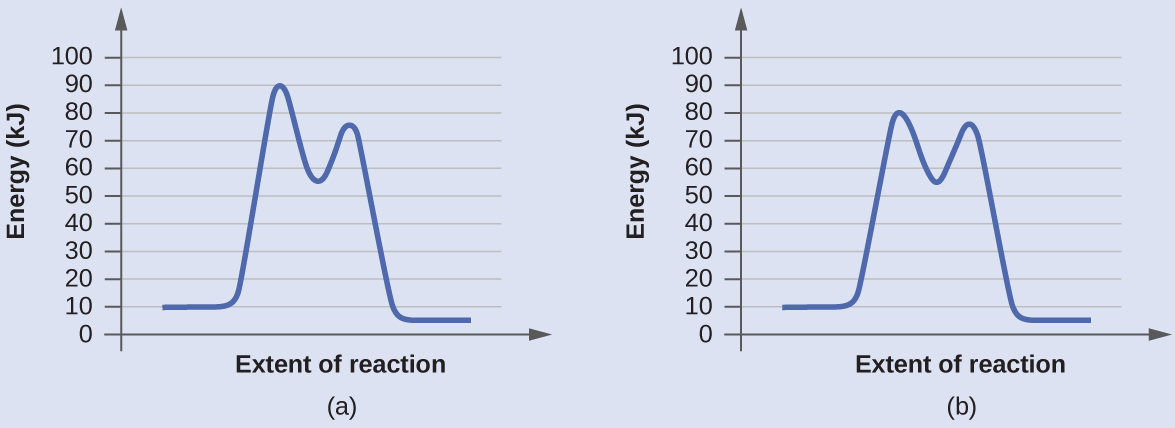
Determine which of the two diagrams here (both for the same reaction) involves a catalyst, and identify the activation energy for the catalyzed reaction:

In this figure, two graphs are shown. The x-axes are labeled, “Extent of reaction,” and the y-axes are labeledc “Energy (k J).” The y-axes are marked off from 0 to 100 at intervals of 10. In a, a blue curve is shown. It begins with a horizontal segment at about 10. The curve then rises sharply near the middle to reach a maximum of about 91, then sharply falls to about 52, again rises sharply to about 73 and falls to another horizontal segment at about 5. In b, the curve begins and ends similarly, but the first peak reaches about 81, drops to about 55, then rises to about 77 before falling to the horizontal region at about 5.

Answer:

Diagram (b) is a catalyzed reaction with an activation energy of about 70 kJ.

Got questions? Get instant answers now!

Questions & Answers

how does the planets on our solar system orbit
cheten Reply
how many Messier objects are there in space
satish Reply
did you g8ve certificate
Richard Reply
what are astronomy
Issan Reply
Astronomy (from Ancient Greek ἀστρονομία (astronomía) 'science that studies the laws of the stars') is a natural science that studies celestial objects and phenomena. It uses mathematics, physics, and chemistry in order to explain their origin and evolution.
Rafael
vjuvu
Elgoog
what is big bang theory?
Rosemary
what type of activity astronomer do?
Rosemary
No
Richard
the big bang theory is a theory which states that all matter was compressed together in one place the matter got so unstable it exploded releasing All its contents in the form of hydrogen
Roaul
I want to be an astronomer. That's my dream
Astrit
Who named the the whole galaxy?
Shola Reply
solar Univers
GPOWER
what is space
Richard
what is the dark matter
Richard
what are the factors upon which the atmosphere is stratified
Nicholas Reply
is the big bang the sun
Folakemi Reply
no
Sokak
bigbang is the beginning of the universe
Sokak
but thats just a theory
Sokak
nothing will happen, don't worry brother.
Vansh
what does comet means
GANGAIN Reply
these are Rocky substances between mars and jupiter
GANGAIN
Comets are cosmic snowballs of frozen gases , rock and dust that orbit the sun. They are mostly found between the orbits of Venus and Mercury.
Aarya
hllo
John
hi
John
qt rrt
John
r u there
John
hey can anyone guide me abt international astronomy olympiad
sahil
how can we learn right and true ?
Govinda Reply
why the moon is always appear in an elliptical shape
Gatjuol Reply
Because when astroid hit the Earth then a piece of elliptical shape of the earth was separated which is now called moon.
Hemen
what's see level?
lidiya Reply
Did you mean eye sight or sea level
Minal
oh sorry it's sea level
lidiya
according to the theory of astronomers why the moon is always appear in an elliptical orbit?
Gatjuol
hi !!! I am new in astronomy.... I have so many questions in mind .... all of scientists of the word they just give opinion only. but they never think true or false ... i respect all of them... I believes whole universe depending on true ...থিউরি
Govinda
hello
Jackson
hi
Elyana
we're all stars and galaxies a part of sun. how can science prove thx with respect old ancient times picture or books..or anything with respect to present time .but we r a part of that universe
w astronomy and cosmology!
Michele
another theory of universe except big ban
Albash Reply
how was universe born
Asmit Reply
there many theory to born universe but what is the reality of big bang theory to born universe
Asmit
what is the exact value of π?
Nagalakshmi
by big bang
universal
there are many theories regarding this it's on you believe any theory that you think is true ex. eternal inflation theory, oscillation model theory, multiple universe theory the big bang theory etc.
Aarya
I think after Big Bang!
Michele
from where on earth could u observe all the stars during the during the course of an year
Karuna Reply
I think it couldn't possible on earth
Nagalakshmi
in this time i don't Know
Michele
is that so. the question was in the end of this chapter
Karuna
in theory, you could see them all from the equator (though over the course of a year, not at pne time). stars are measured in "declination", which is how far N or S of the equator (90* to -90*). Polaris is the North star, and is ALMOST 90* (+89*). So it would just barely creep over the horizon.
Christopher
Got questions? Join the online conversation and get instant answers!
Jobilize.com Reply
Practice Key Terms 2

Get Jobilize Job Search Mobile App in your pocket Now!

Get it on Google Play Download on the App Store Now


Source:  OpenStax, Chemistry. OpenStax CNX. May 20, 2015 Download for free at http://legacy.cnx.org/content/col11760/1.9
Google Play and the Google Play logo are trademarks of Google Inc.

Notification Switch

Would you like to follow the 'Chemistry' conversation and receive update notifications?

Ask