<< Chapter < Page Chapter >> Page >
By the end of this section, you will be able to:
  • Explain the function of a catalyst in terms of reaction mechanisms and potential energy diagrams
  • List examples of catalysis in natural and industrial processes

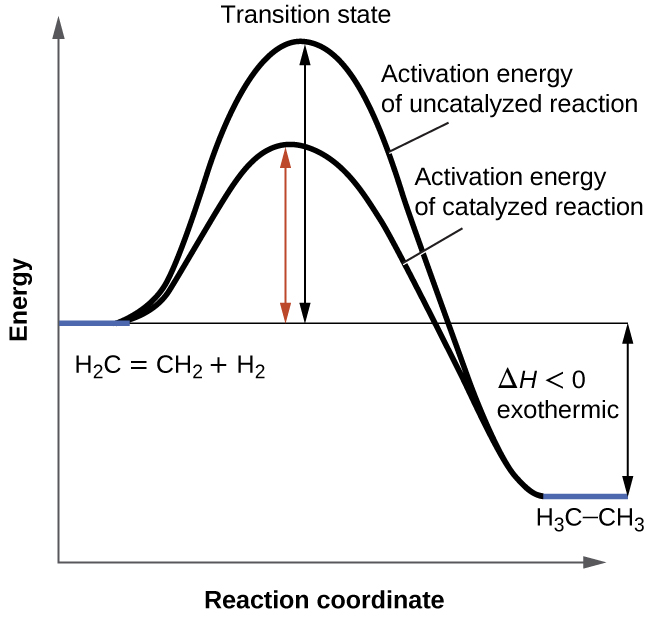
We have seen that the rate of many reactions can be accelerated by catalysts. A catalyst speeds up the rate of a reaction by lowering the activation energy; in addition, the catalyst is regenerated in the process. Several reactions that are thermodynamically favorable in the absence of a catalyst only occur at a reasonable rate when a catalyst is present. One such reaction is catalytic hydrogenation, the process by which hydrogen is added across an alkene C=C bond to afford the saturated alkane product. A comparison of the reaction coordinate diagrams (also known as energy diagrams) for catalyzed and uncatalyzed alkene hydrogenation is shown in [link] .

A graph is shown with the label, “Reaction coordinate,” on the x-axis and the label,“Energy,” on the y-axis. Approximately half-way up the y-axis, a short portion of a black concave down curve which has a horizontal line extended from it across the graph. The left end of this line is labeled “H subscript 2 C equals C H subscript 2 plus H subscript 2.” The black concave down curve extends upward to reach a maximum near the height of the y-axis. The peak of this curve is labeled, “Transition state.” A double sided arrow extends from the horizontal line to the peak of the curve. This arrow is labeled, “Activation energy of Uncatalyzed reation.” From the peak, the curve continues downward to a second horizontally flattened region well below the origin of the curve near the x-axis. This flattened region is shaded in blue and is labeled “H subscript 3 C dash C H subscript 3.” A double sided arrow is drawn from the lowers part of this curve at the far right of the graph to the line extending across the graph above it. This arrow is labeled, “capital delta H less than 0 : exothermic.” A second curve is drawn with the same flattened regions at the start and end of the curve. The height of this curve is about two-thirds the height of the first curve. A double sided arrow is drawn from the horizontal line that originates at the left side of the graph to the peak of this second curve. This arrow is labeled, “Activation energy of catalyzed reaction.”
This graph compares the reaction coordinates for catalyzed and uncatalyzed alkene hydrogenation.

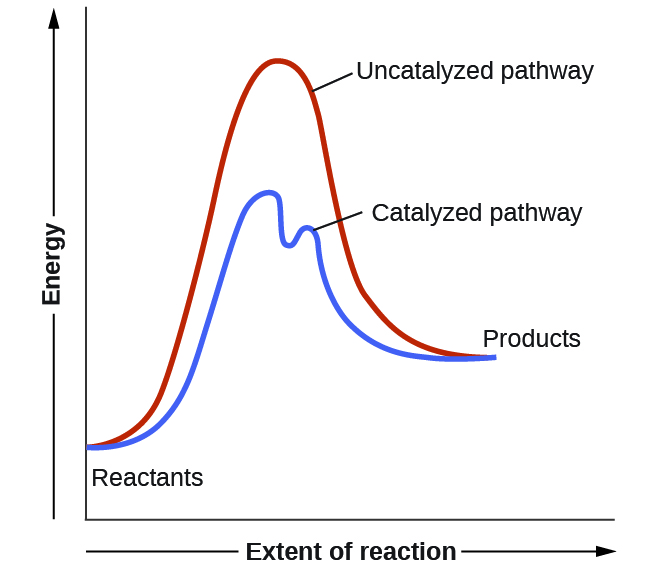
Catalysts function by providing an alternate reaction mechanism that has a lower activation energy than would be found in the absence of the catalyst. In some cases, the catalyzed mechanism may include additional steps, as depicted in the reaction diagrams shown in [link] . This lower activation energy results in an increase in rate as described by the Arrhenius equation. Note that a catalyst decreases the activation energy for both the forward and the reverse reactions and hence accelerates both the forward and the reverse reactions . Consequently, the presence of a catalyst will permit a system to reach equilibrium more quickly, but it has no effect on the position of the equilibrium as reflected in the value of its equilibrium constant (see the later chapter on chemical equilibrium).

A graph is shown with the label, “Extent of reaction,” appearing in a right pointing arrow below the x-axis and the label, “Energy,” in an upward pointing arrow just left of the y-axis. Approximately one-fifth of the way up the y-axis, a very short, somewhat flattened portion of both a red and a blue curve are shown. This region is labeled “Reactants.” A red concave down curve extends upward to reach a maximum near the height of the y-axis. This curve is labeled, “Uncatalyzed pathway.” From the peak, the curve continues downward to a second horizontally flattened region at a height of about one-third the height of the y-axis. This flattened region is labeled, “Products.” A second curve is drawn in blue with the same flattened regions at the start and end of the curve. The height of this curve is about two-thirds the height of the first curve and just right of its maximum, the curve dips low, then rises back and continues a downward trend at a lower height, but similar to that of the red curve. This blue curve is labeled, “Catalyzed pathway.”
This potential energy diagram shows the effect of a catalyst on the activation energy. The catalyst provides a different reaction path with a lower activation energy. As shown, the catalyzed pathway involves a two-step mechanism (note the presence of two transition states) and an intermediate species (represented by the valley between the two transitions states).

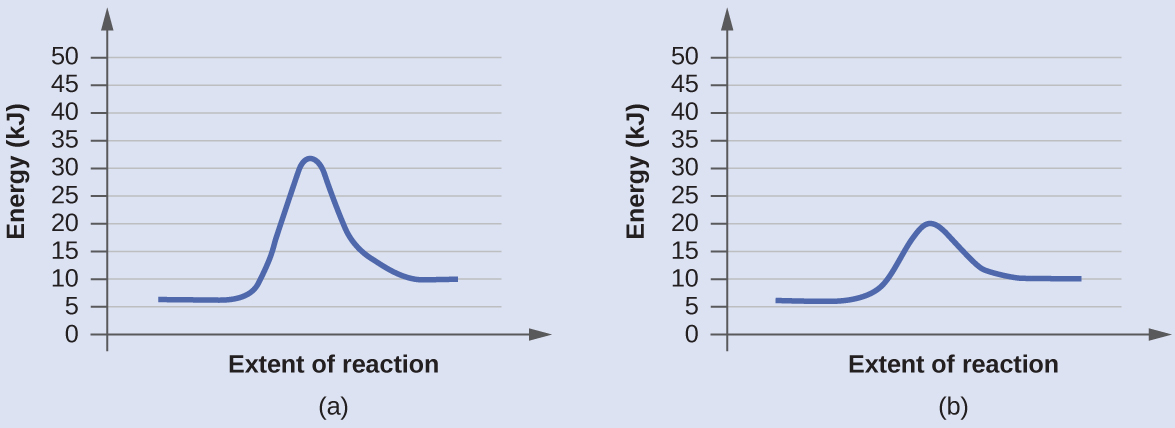
Using reaction diagrams to compare catalyzed reactions

The two reaction diagrams here represent the same reaction: one without a catalyst and one with a catalyst. Identify which diagram suggests the presence of a catalyst, and determine the activation energy for the catalyzed reaction:

In this figure, two graphs are shown. The x-axes are labeled, “Extent of reaction,” and the y-axes are labeled, “Energy ( k J ).” The y-axes are marked off from 0 to 50 in intervals of five. In a, a blue curve is shown. It begins with a horizontal segment at about 6. The curve then rises sharply near the middle to reach a maximum of about 32 and similarly falls to another horizontal segment at about 10. In b, the curve begins and ends similarly, but the maximum reached near the center of the graph is only 20.

Solution

A catalyst does not affect the energy of reactant or product, so those aspects of the diagrams can be ignored; they are, as we would expect, identical in that respect. There is, however, a noticeable difference in the transition state, which is distinctly lower in diagram (b) than it is in (a). This indicates the use of a catalyst in diagram (b). The activation energy is the difference between the energy of the starting reagents and the transition state—a maximum on the reaction coordinate diagram. The reagents are at 6 kJ and the transition state is at 20 kJ, so the activation energy can be calculated as follows:
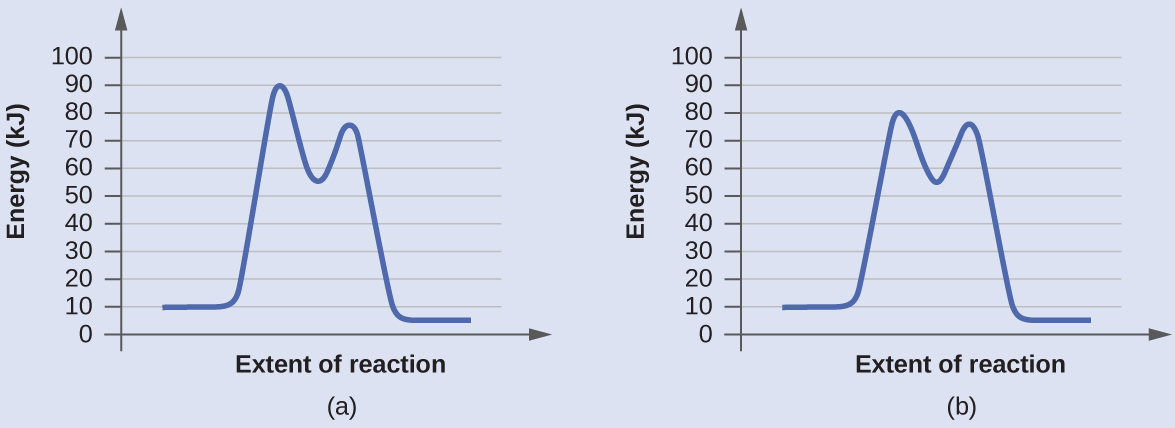
E a = 20 kJ 6 kJ = 14 kJ

Check your learning

Determine which of the two diagrams here (both for the same reaction) involves a catalyst, and identify the activation energy for the catalyzed reaction:

In this figure, two graphs are shown. The x-axes are labeled, “Extent of reaction,” and the y-axes are labeledc “Energy (k J).” The y-axes are marked off from 0 to 100 at intervals of 10. In a, a blue curve is shown. It begins with a horizontal segment at about 10. The curve then rises sharply near the middle to reach a maximum of about 91, then sharply falls to about 52, again rises sharply to about 73 and falls to another horizontal segment at about 5. In b, the curve begins and ends similarly, but the first peak reaches about 81, drops to about 55, then rises to about 77 before falling to the horizontal region at about 5.

Answer:

Diagram (b) is a catalyzed reaction with an activation energy of about 70 kJ.

Got questions? Get instant answers now!

Questions & Answers

Discuss the differences between taste and flavor, including how other sensory inputs contribute to our  perception of flavor.
John Reply
taste refers to your understanding of the flavor . while flavor one The other hand is refers to sort of just a blend things.
Faith
While taste primarily relies on our taste buds, flavor involves a complex interplay between taste and aroma
Kamara
which drugs can we use for ulcers
Ummi Reply
omeprazole
Kamara
what
Renee
what is this
Renee
is a drug
Kamara
of anti-ulcer
Kamara
Omeprazole Cimetidine / Tagament For the complicated once ulcer - kit
Patrick
what is the function of lymphatic system
Nency Reply
Not really sure
Eli
to drain extracellular fluid all over the body.
asegid
The lymphatic system plays several crucial roles in the human body, functioning as a key component of the immune system and contributing to the maintenance of fluid balance. Its main functions include: 1. Immune Response: The lymphatic system produces and transports lymphocytes, which are a type of
asegid
to transport fluids fats proteins and lymphocytes to the blood stream as lymph
Adama
what is anatomy
Oyindarmola Reply
Anatomy is the identification and description of the structures of living things
Kamara
what's the difference between anatomy and physiology
Oyerinde Reply
Anatomy is the study of the structure of the body, while physiology is the study of the function of the body. Anatomy looks at the body's organs and systems, while physiology looks at how those organs and systems work together to keep the body functioning.
AI-Robot
what is enzymes all about?
Mohammed Reply
Enzymes are proteins that help speed up chemical reactions in our bodies. Enzymes are essential for digestion, liver function and much more. Too much or too little of a certain enzyme can cause health problems
Kamara
yes
Prince
how does the stomach protect itself from the damaging effects of HCl
Wulku Reply
little girl okay how does the stomach protect itself from the damaging effect of HCL
Wulku
it is because of the enzyme that the stomach produce that help the stomach from the damaging effect of HCL
Kamara
function of digestive system
Ali Reply
function of digestive
Ali
the diagram of the lungs
Adaeze Reply
what is the normal body temperature
Diya Reply
37 degrees selcius
Xolo
37°c
Stephanie
please why 37 degree selcius normal temperature
Mark
36.5
Simon
37°c
Iyogho
the normal temperature is 37°c or 98.6 °Fahrenheit is important for maintaining the homeostasis in the body the body regular this temperature through the process called thermoregulation which involves brain skin muscle and other organ working together to maintain stable internal temperature
Stephanie
37A c
Wulku
what is anaemia
Diya Reply
anaemia is the decrease in RBC count hemoglobin count and PVC count
Eniola
what is the pH of the vagina
Diya Reply
how does Lysin attack pathogens
Diya
acid
Mary
I information on anatomy position and digestive system and there enzyme
Elisha Reply
anatomy of the female external genitalia
Muhammad Reply
Organ Systems Of The Human Body (Continued) Organ Systems Of The Human Body (Continued)
Theophilus Reply
what's lochia albra
Kizito
Got questions? Join the online conversation and get instant answers!
Jobilize.com Reply
Practice Key Terms 2

Get Jobilize Job Search Mobile App in your pocket Now!

Get it on Google Play Download on the App Store Now


Source:  OpenStax, Chemistry. OpenStax CNX. May 20, 2015 Download for free at http://legacy.cnx.org/content/col11760/1.9
Google Play and the Google Play logo are trademarks of Google Inc.

Notification Switch

Would you like to follow the 'Chemistry' conversation and receive update notifications?

Ask