Explain the function of a catalyst in terms of reaction mechanisms and potential energy diagrams
List examples of catalysis in natural and industrial processes
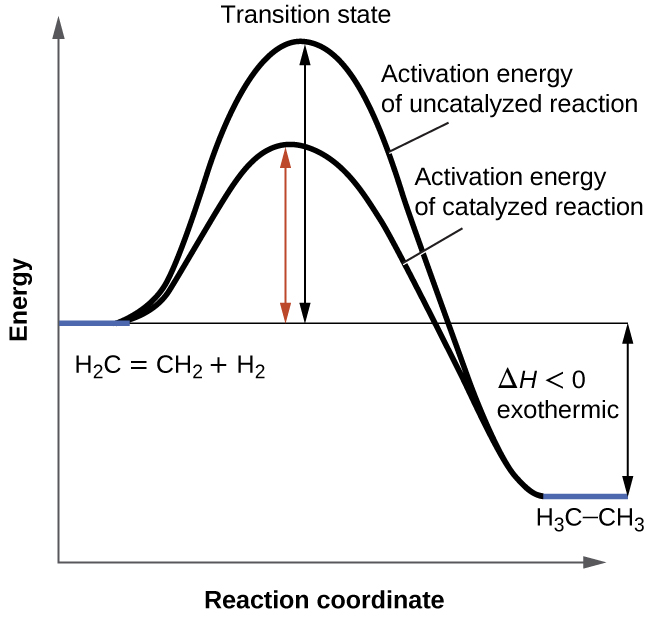
We have seen that the rate of many reactions can be accelerated by catalysts. A catalyst speeds up the rate of a reaction by lowering the activation energy; in addition, the catalyst is regenerated in the process. Several reactions that are thermodynamically favorable in the absence of a catalyst only occur at a reasonable rate when a catalyst is present. One such reaction is catalytic hydrogenation, the process by which hydrogen is added across an alkene C=C bond to afford the saturated alkane product. A comparison of the reaction coordinate diagrams (also known as energy diagrams) for catalyzed and uncatalyzed alkene hydrogenation is shown in
[link] .
This graph compares the reaction coordinates for catalyzed and uncatalyzed alkene hydrogenation.
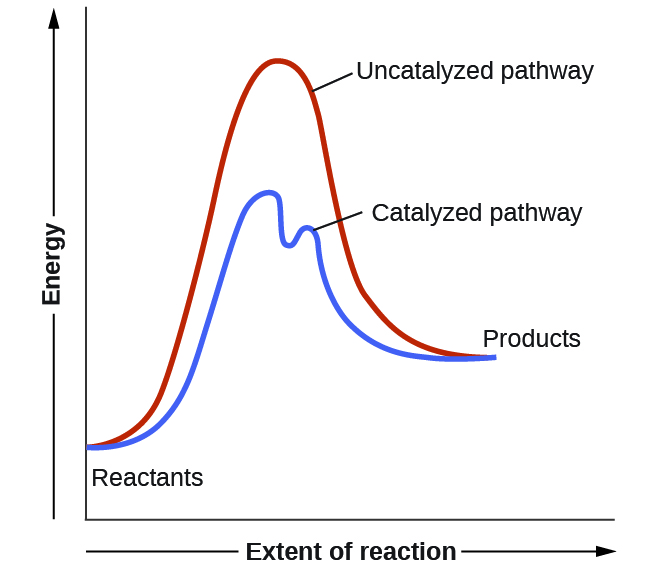
Catalysts function by providing an alternate reaction mechanism that has a lower activation energy than would be found in the absence of the catalyst. In some cases, the catalyzed mechanism may include additional steps, as depicted in the reaction diagrams shown in
[link] . This lower activation energy results in an increase in rate as described by the Arrhenius equation. Note that a catalyst decreases the activation energy for both the forward and the reverse reactions and hence
accelerates both the forward and the reverse reactions . Consequently, the presence of a catalyst will permit a system to reach equilibrium more quickly, but it has no effect on the position of the equilibrium as reflected in the value of its equilibrium constant (see the later chapter on chemical equilibrium).
This potential energy diagram shows the effect of a catalyst on the activation energy. The catalyst provides a different reaction path with a lower activation energy. As shown, the catalyzed pathway involves a two-step mechanism (note the presence of two transition states) and an intermediate species (represented by the valley between the two transitions states).
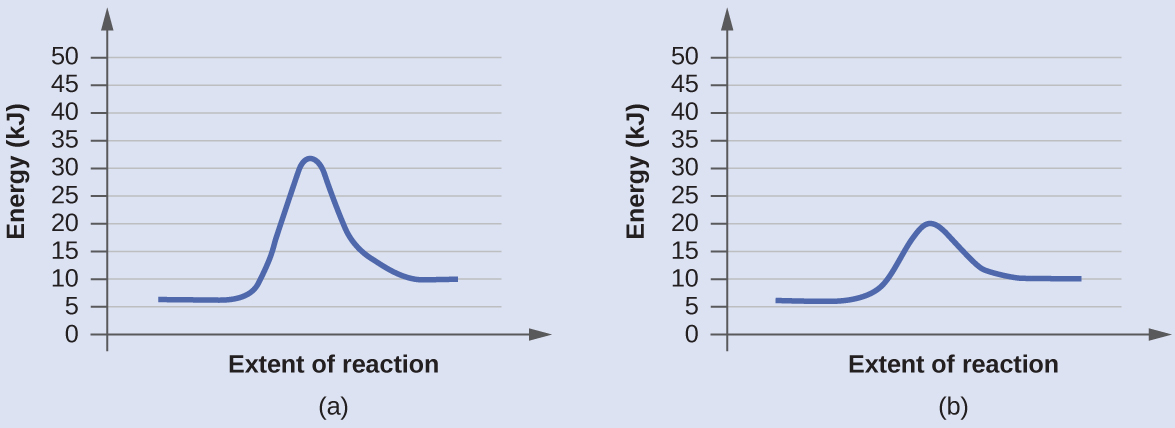
Using reaction diagrams to compare catalyzed reactions
The two reaction diagrams here represent the same reaction: one without a catalyst and one with a catalyst. Identify which diagram suggests the presence of a catalyst, and determine the activation energy for the catalyzed reaction:
Solution
A catalyst does not affect the energy of reactant or product, so those aspects of the diagrams can be ignored; they are, as we would expect, identical in that respect. There is, however, a noticeable difference in the transition state, which is distinctly lower in diagram (b) than it is in (a). This indicates the use of a catalyst in diagram (b). The activation energy is the difference between the energy of the starting reagents and the transition state—a maximum on the reaction coordinate diagram. The reagents are at 6 kJ and the transition state is at 20 kJ, so the activation energy can be calculated as follows:
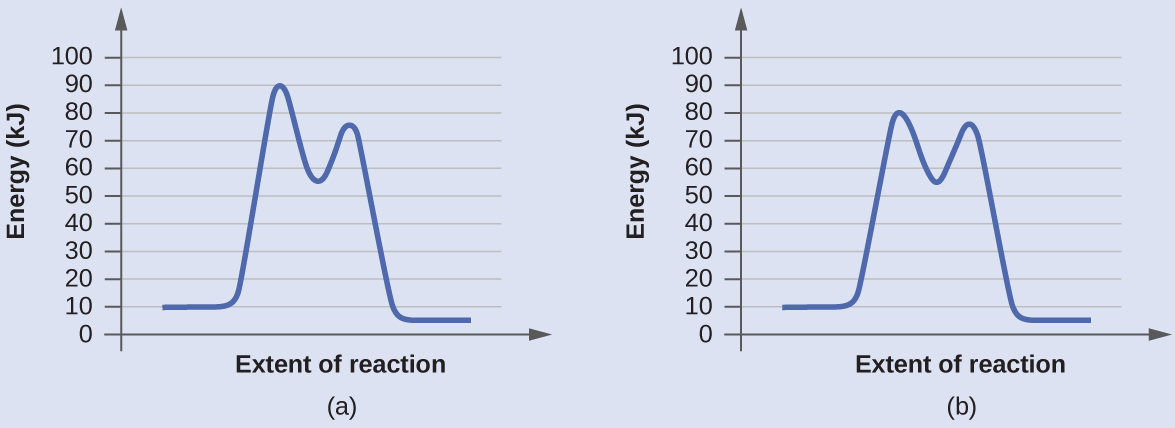
Check your learning
Determine which of the two diagrams here (both for the same reaction) involves a catalyst, and identify the activation energy for the catalyzed reaction:
Answer:
Diagram (b) is a catalyzed reaction with an activation energy of about 70 kJ.
Communication is effective because it allows individuals to share ideas, thoughts, and information with others.
effective communication can lead to improved outcomes in various settings, including personal relationships, business environments, and educational settings. By communicating effectively, individuals can negotiate effectively, solve problems collaboratively, and work towards common goals.
it starts up serve and return practice/assessments.it helps find voice talking therapy also assessments through relaxed conversation.
miss
Every time someone flushes a toilet in the apartment building, the person begins to jumb back automatically after hearing the flush, before the water temperature changes. Identify the types of learning, if it is classical conditioning identify the NS, UCS, CS and CR. If it is operant conditioning, identify the type of consequence positive reinforcement, negative reinforcement or punishment
nature is an hereditary factor while nurture is an environmental factor which constitute an individual personality. so if an individual's parent has a deviant behavior and was also brought up in an deviant environment, observation of the behavior and the inborn trait we make the individual deviant.
Samuel
I am taking this course because I am hoping that I could somehow learn more about my chosen field of interest and due to the fact that being a PsyD really ignites my passion as an individual the more I hope to learn about developing and literally explore the complexity of my critical thinking skills
hello. autism is a umbrella term. autistic kids have different disorder overlapping. for example. a kid may show symptoms of ADHD and also learning disabilities.
before treatment please make sure the kid doesn't have physical disabilities like hearing..vision..speech problem. sometimes these
Jharna
continue..
sometimes due to these physical problems..the diagnosis may be misdiagnosed.
treatment for autism.
well it depends on the severity.
since autistic kids have problems in communicating and adopting to the environment.. it's best to expose the child in situations where the child
Jharna
child interact with other kids under doc supervision.
play therapy.
speech therapy.
Engaging in different activities that activate most parts of the brain.. like drawing..painting. matching color board game.
string and beads game.
the more you interact with the child the more effective
Jharna
results you'll get..
please consult a therapist to know what suits best on your child.
and last as a parent. I know sometimes it's overwhelming to guide a special kid.
but trust the process and be strong and patient as a parent.
Jharna
Got questions? Join the online conversation and get instant answers!