<< Chapter < Page Chapter >> Page >
By the end of this section, you will be able to:
  • Describe the arrangement of atoms and ions in crystalline structures
  • Compute ionic radii using unit cell dimensions
  • Explain the use of X-ray diffraction measurements in determining crystalline structures

Over 90% of naturally occurring and man-made solids are crystalline. Most solids form with a regular arrangement of their particles because the overall attractive interactions between particles are maximized, and the total intermolecular energy is minimized, when the particles pack in the most efficient manner. The regular arrangement at an atomic level is often reflected at a macroscopic level. In this module, we will explore some of the details about the structures of metallic and ionic crystalline solids, and learn how these structures are determined experimentally.

The structures of metals

We will begin our discussion of crystalline solids by considering elemental metals, which are relatively simple because each contains only one type of atom. A pure metal is a crystalline solid with metal atoms packed closely together in a repeating pattern. Some of the properties of metals in general, such as their malleability and ductility, are largely due to having identical atoms arranged in a regular pattern. The different properties of one metal compared to another partially depend on the sizes of their atoms and the specifics of their spatial arrangements. We will explore the similarities and differences of four of the most common metal crystal geometries in the sections that follow.

Unit cells of metals

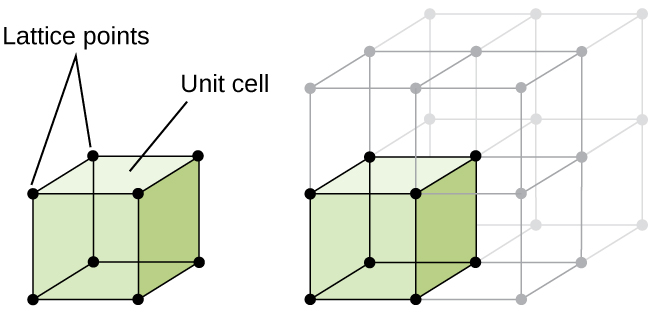
The structure of a crystalline solid, whether a metal or not, is best described by considering its simplest repeating unit, which is referred to as its unit cell    . The unit cell consists of lattice points that represent the locations of atoms or ions. The entire structure then consists of this unit cell repeating in three dimensions, as illustrated in [link] .

A diagram of two images is shown. In the first image, a cube with a sphere at each corner is shown. The cube is labeled “Unit cell” and the spheres at the corners are labeled “Lattice points.” The second image shows the same cube, but this time it is one cube amongst eight that make up a larger cube. The original cube is shaded a color while the other cubes are not.
A unit cell shows the locations of lattice points repeating in all directions.

Let us begin our investigation of crystal lattice structure and unit cells with the most straightforward structure and the most basic unit cell. To visualize this, imagine taking a large number of identical spheres, such as tennis balls, and arranging them uniformly in a container. The simplest way to do this would be to make layers in which the spheres in one layer are directly above those in the layer below, as illustrated in [link] . This arrangement is called simple cubic structure    , and the unit cell is called the simple cubic unit cell    or primitive cubic unit cell.

A diagram of three images is shown. In the first image, a cube with a sphere at each corner is shown. The spheres at the corners are circled. The second image shows the same cube, but this time the spheres at the corners are larger and shaded in. In the third image, the cube is one cube amongst eight that make up a larger cube. The original cube is shaded a color while the other cubes are not.
When metal atoms are arranged with spheres in one layer directly above or below spheres in another layer, the lattice structure is called simple cubic. Note that the spheres are in contact.

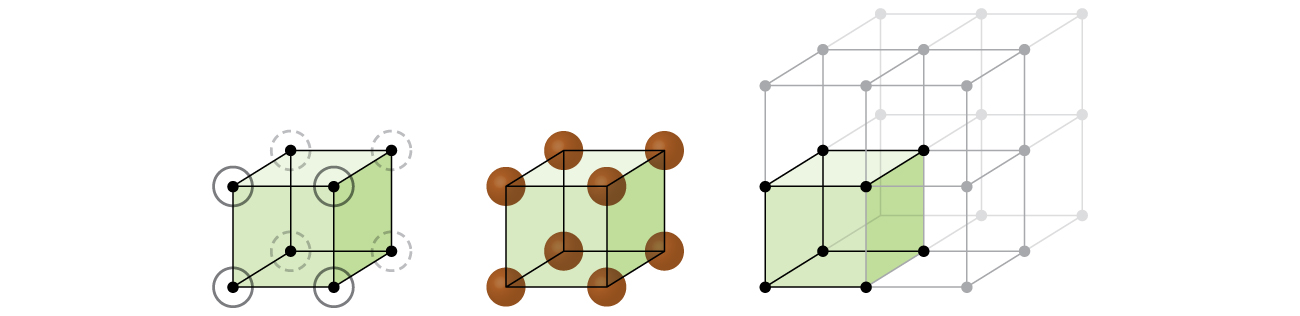
In a simple cubic structure, the spheres are not packed as closely as they could be, and they only “fill” about 52% of the volume of the container. This is a relatively inefficient arrangement, and only one metal (polonium, Po) crystallizes in a simple cubic structure. As shown in [link] , a solid with this type of arrangement consists of planes (or layers) in which each atom contacts only the four nearest neighbors in its layer; one atom directly above it in the layer above; and one atom directly below it in the layer below. The number of other particles that each particle in a crystalline solid contacts is known as its coordination number    . For a polonium atom in a simple cubic array, the coordination number is, therefore, six.

Questions & Answers

differentiate between demand and supply giving examples
Lambiv Reply
differentiated between demand and supply using examples
Lambiv
what is labour ?
Lambiv
how will I do?
Venny Reply
how is the graph works?I don't fully understand
Rezat Reply
information
Eliyee
devaluation
Eliyee
t
WARKISA
hi guys good evening to all
Lambiv
multiple choice question
Aster Reply
appreciation
Eliyee
explain perfect market
Lindiwe Reply
In economics, a perfect market refers to a theoretical construct where all participants have perfect information, goods are homogenous, there are no barriers to entry or exit, and prices are determined solely by supply and demand. It's an idealized model used for analysis,
Ezea
What is ceteris paribus?
Shukri Reply
other things being equal
AI-Robot
When MP₁ becomes negative, TP start to decline. Extuples Suppose that the short-run production function of certain cut-flower firm is given by: Q=4KL-0.6K2 - 0.112 • Where is quantity of cut flower produced, I is labour input and K is fixed capital input (K-5). Determine the average product of lab
Kelo
Extuples Suppose that the short-run production function of certain cut-flower firm is given by: Q=4KL-0.6K2 - 0.112 • Where is quantity of cut flower produced, I is labour input and K is fixed capital input (K-5). Determine the average product of labour (APL) and marginal product of labour (MPL)
Kelo
yes,thank you
Shukri
Can I ask you other question?
Shukri
what is monopoly mean?
Habtamu Reply
What is different between quantity demand and demand?
Shukri Reply
Quantity demanded refers to the specific amount of a good or service that consumers are willing and able to purchase at a give price and within a specific time period. Demand, on the other hand, is a broader concept that encompasses the entire relationship between price and quantity demanded
Ezea
ok
Shukri
how do you save a country economic situation when it's falling apart
Lilia Reply
what is the difference between economic growth and development
Fiker Reply
Economic growth as an increase in the production and consumption of goods and services within an economy.but Economic development as a broader concept that encompasses not only economic growth but also social & human well being.
Shukri
production function means
Jabir
What do you think is more important to focus on when considering inequality ?
Abdisa Reply
any question about economics?
Awais Reply
sir...I just want to ask one question... Define the term contract curve? if you are free please help me to find this answer 🙏
Asui
it is a curve that we get after connecting the pareto optimal combinations of two consumers after their mutually beneficial trade offs
Awais
thank you so much 👍 sir
Asui
In economics, the contract curve refers to the set of points in an Edgeworth box diagram where both parties involved in a trade cannot be made better off without making one of them worse off. It represents the Pareto efficient allocations of goods between two individuals or entities, where neither p
Cornelius
In economics, the contract curve refers to the set of points in an Edgeworth box diagram where both parties involved in a trade cannot be made better off without making one of them worse off. It represents the Pareto efficient allocations of goods between two individuals or entities,
Cornelius
Suppose a consumer consuming two commodities X and Y has The following utility function u=X0.4 Y0.6. If the price of the X and Y are 2 and 3 respectively and income Constraint is birr 50. A,Calculate quantities of x and y which maximize utility. B,Calculate value of Lagrange multiplier. C,Calculate quantities of X and Y consumed with a given price. D,alculate optimum level of output .
Feyisa Reply
Answer
Feyisa
c
Jabir
the market for lemon has 10 potential consumers, each having an individual demand curve p=101-10Qi, where p is price in dollar's per cup and Qi is the number of cups demanded per week by the i th consumer.Find the market demand curve using algebra. Draw an individual demand curve and the market dema
Gsbwnw Reply
suppose the production function is given by ( L, K)=L¼K¾.assuming capital is fixed find APL and MPL. consider the following short run production function:Q=6L²-0.4L³ a) find the value of L that maximizes output b)find the value of L that maximizes marginal product
Abdureman
types of unemployment
Yomi Reply
What is the difference between perfect competition and monopolistic competition?
Mohammed
Got questions? Join the online conversation and get instant answers!
Jobilize.com Reply

Get Jobilize Job Search Mobile App in your pocket Now!

Get it on Google Play Download on the App Store Now


Source:  OpenStax, Chemistry. OpenStax CNX. May 20, 2015 Download for free at http://legacy.cnx.org/content/col11760/1.9
Google Play and the Google Play logo are trademarks of Google Inc.

Notification Switch

Would you like to follow the 'Chemistry' conversation and receive update notifications?

Ask