<< Chapter < Page Chapter >> Page >
  • Describe the epsilon-delta definition of a limit.
  • Apply the epsilon-delta definition to find the limit of a function.
  • Describe the epsilon-delta definitions of one-sided limits and infinite limits.
  • Use the epsilon-delta definition to prove the limit laws.

By now you have progressed from the very informal definition of a limit in the introduction of this chapter to the intuitive understanding of a limit. At this point, you should have a very strong intuitive sense of what the limit of a function means and how you can find it. In this section, we convert this intuitive idea of a limit into a formal definition using precise mathematical language. The formal definition of a limit is quite possibly one of the most challenging definitions you will encounter early in your study of calculus; however, it is well worth any effort you make to reconcile it with your intuitive notion of a limit. Understanding this definition is the key that opens the door to a better understanding of calculus.

Quantifying closeness

Before stating the formal definition of a limit, we must introduce a few preliminary ideas. Recall that the distance between two points a and b on a number line is given by | a b | .

  • The statement | f ( x ) L | < ε may be interpreted as: The distance between f ( x ) and L is less than ε.
  • The statement 0 < | x a | < δ may be interpreted as: x a and the distance between x and a is less than δ.

It is also important to look at the following equivalences for absolute value:

  • The statement | f ( x ) L | < ε is equivalent to the statement L ε < f ( x ) < L + ε .
  • The statement 0 < | x a | < δ is equivalent to the statement a δ < x < a + δ and x a .

With these clarifications, we can state the formal epsilon-delta definition of the limit    .

Definition

Let f ( x ) be defined for all x a over an open interval containing a . Let L be a real number. Then

lim x a f ( x ) = L

if, for every ε > 0 , there exists a δ > 0 , such that if 0 < | x a | < δ , then | f ( x ) L | < ε .

This definition may seem rather complex from a mathematical point of view, but it becomes easier to understand if we break it down phrase by phrase. The statement itself involves something called a universal quantifier (for every ε > 0 ), an existential quantifier (there exists a δ > 0 ), and, last, a conditional statement (if 0 < | x a | < δ , then | f ( x ) L | < ε ). Let’s take a look at [link] , which breaks down the definition and translates each part.

Translation of the epsilon-delta definition of the limit
Definition Translation
1. For every ε > 0 , 1. For every positive distance ε from L ,
2. there exists a δ > 0 , 2. There is a positive distance δ from a ,
3. such that 3. such that
4. if 0 < | x a | < δ , then | f ( x ) L | < ε . 4. if x is closer than δ to a and x a , then f ( x ) is closer than ε to L .

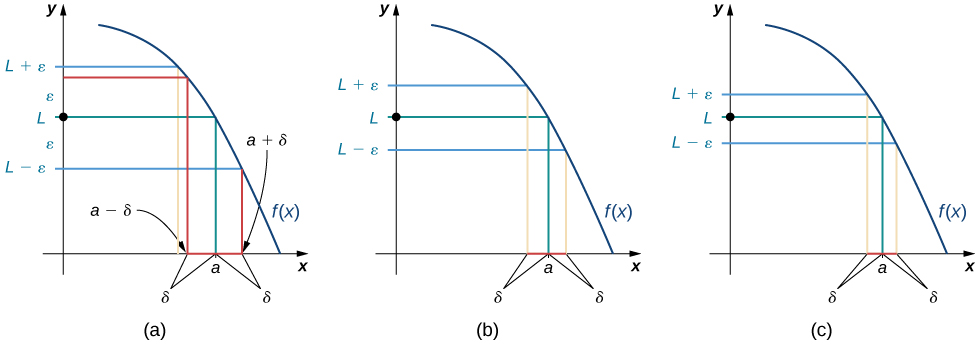
We can get a better handle on this definition by looking at the definition geometrically. [link] shows possible values of δ for various choices of ε > 0 for a given function f ( x ) , a number a , and a limit L at a . Notice that as we choose smaller values of ε (the distance between the function and the limit), we can always find a δ small enough so that if we have chosen an x value within δ of a , then the value of f ( x ) is within ε of the limit L .

There are three graphs side by side showing possible values of delta, given successively smaller choices of epsilon. Each graph has a decreasing, concave down curve in quadrant one. Each graph has the point (a, L) marked on the curve, where L is the limit of the function at the point where x=a. On either side of L on the y axis, a distance epsilon is marked off  - namely, a line is drawn through the function at y = L + epsilon and L – epsilon. As smaller values of epsilon are chosen going from graph one to graph three, smaller values of delta to the left and right of point a can be found so that if we have chosen an x value within delta of a, then the value of f(x) is within epsilon of the limit L.
These graphs show possible values of δ , given successively smaller choices of ε .

Questions & Answers

how do you get the 2/50
Abba Reply
number of sport play by 50 student construct discrete data
Aminu Reply
width of the frangebany leaves on how to write a introduction
Theresa Reply
Solve the mean of variance
Veronica Reply
Step 1: Find the mean. To find the mean, add up all the scores, then divide them by the number of scores. ... Step 2: Find each score's deviation from the mean. ... Step 3: Square each deviation from the mean. ... Step 4: Find the sum of squares. ... Step 5: Divide the sum of squares by n – 1 or N.
kenneth
what is error
Yakuba Reply
Is mistake done to something
Vutshila
Hy
anas
hy
What is the life teble
anas
hy
Jibrin
statistics is the analyzing of data
Tajudeen Reply
what is statics?
Zelalem Reply
how do you calculate mean
Gloria Reply
diveving the sum if all values
Shaynaynay
let A1,A2 and A3 events be independent,show that (A1)^c, (A2)^c and (A3)^c are independent?
Fisaye Reply
what is statistics
Akhisani Reply
data collected all over the world
Shaynaynay
construct a less than and more than table
Imad Reply
The sample of 16 students is taken. The average age in the sample was 22 years with astandard deviation of 6 years. Construct a 95% confidence interval for the age of the population.
Aschalew Reply
Bhartdarshan' is an internet-based travel agency wherein customer can see videos of the cities they plant to visit. The number of hits daily is a normally distributed random variable with a mean of 10,000 and a standard deviation of 2,400 a. what is the probability of getting more than 12,000 hits? b. what is the probability of getting fewer than 9,000 hits?
Akshay Reply
Bhartdarshan'is an internet-based travel agency wherein customer can see videos of the cities they plan to visit. The number of hits daily is a normally distributed random variable with a mean of 10,000 and a standard deviation of 2,400. a. What is the probability of getting more than 12,000 hits
Akshay
1
Bright
Sorry i want to learn more about this question
Bright
Someone help
Bright
a= 0.20233 b=0.3384
Sufiyan
a
Shaynaynay
How do I interpret level of significance?
Mohd Reply
It depends on your business problem or in Machine Learning you could use ROC- AUC cruve to decide the threshold value
Shivam
how skewness and kurtosis are used in statistics
Owen Reply
yes what is it
Taneeya
Got questions? Join the online conversation and get instant answers!
Jobilize.com Reply
Practice Key Terms 2

Get Jobilize Job Search Mobile App in your pocket Now!

Get it on Google Play Download on the App Store Now


Source:  OpenStax, Calculus volume 1. OpenStax CNX. Feb 05, 2016 Download for free at http://cnx.org/content/col11964/1.2
Google Play and the Google Play logo are trademarks of Google Inc.

Notification Switch

Would you like to follow the 'Calculus volume 1' conversation and receive update notifications?

Ask