<< Chapter < Page Chapter >> Page >
 Photos A and B show what appears to be virtually identical looking wasps, but B is actually a harmless hoverfly.
One form of mimicry is when a harmless species mimics the coloration of a harmful species, as is seen with the (a) wasp ( Polistes sp.) and the (b) hoverfly ( Syrphus sp.). (credit: modification of work by Tom Ings)

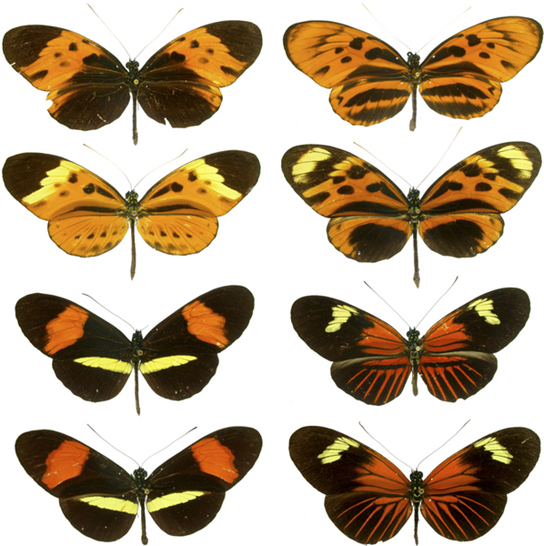
In other cases of mimicry, multiple species share the same warning coloration, but all of them actually have defenses. The commonness of the signal improves the compliance of all the potential predators. [link] shows a variety of foul-tasting butterflies with similar coloration.

 Photos show four pairs of butterflies that are virtually identical to one another in color and banding pattern.
Several unpleasant-tasting Heliconius butterfly species share a similar color pattern with better-tasting varieties, an example of mimicry. (credit: Joron M, Papa R, Beltrán M, Chamberlain N, Mavárez J, et al.)

Concept in action

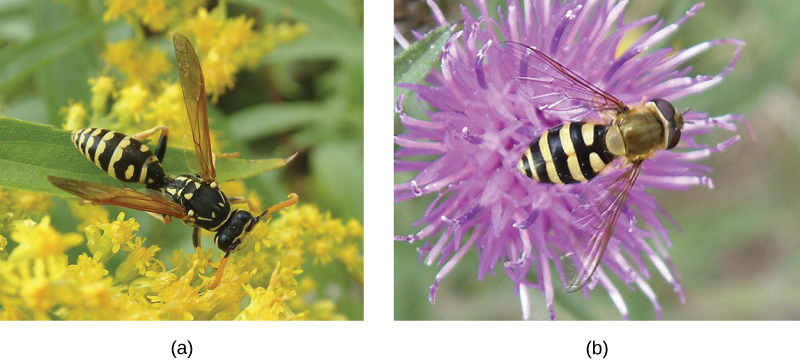
Go to this website to view stunning examples of mimicry.

Competitive exclusion principle

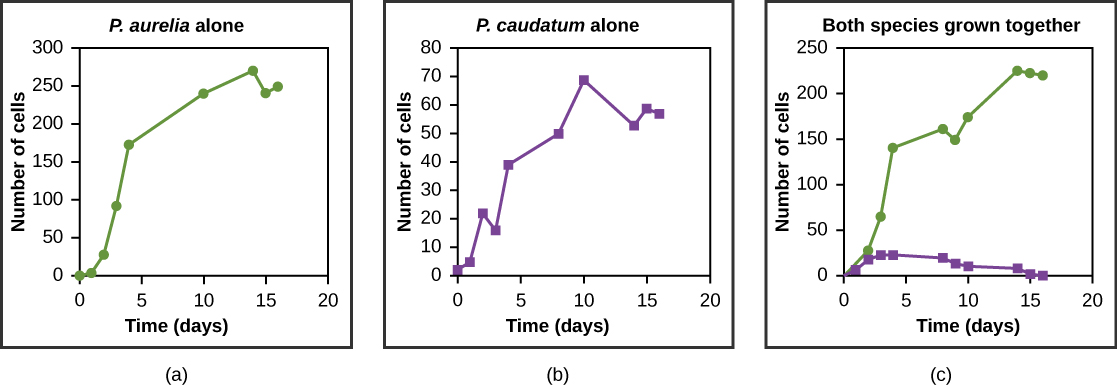
Resources are often limited within a habitat and multiple species may compete to obtain them. Ecologists have come to understand that all species have an ecological niche. A niche is the unique set of resources used by a species, which includes its interactions with other species. The competitive exclusion principle    states that two species cannot occupy the same niche in a habitat: in other words, different species cannot coexist in a community if they are competing for all the same resources. This principle works because if there is an overlap in resource use and therefore competition between two species, then traits that lessen reliance on the shared resource will be selected for leading to evolution that reduces the overlap. If either species is unable to evolve to reduce competition, then the species that most efficiently exploits the resource will drive the other species to extinction. An experimental example of this principle is shown in [link] with two protozoan species: Paramecium aurelia and Paramecium caudatum . When grown individually in the laboratory, they both thrive. But when they are placed together in the same test tube (habitat), P. aurelia outcompetes P. caudatum for food, leading to the latter’s eventual extinction.

 The three graphs all plot number of cells versus time in days. In Graph (a), P. aurelia is grown alone. In graph (b), P. caudatum is grown alone. In graph (c), the two species are grown together. When grown together, the two species both exhibit logistic growth and grow to a relatively high cell density. When the two species are grown together, P. aurelia shows logistic growth to nearly the same cell density as it exhibited when grown alone, but P. caudatum hardly grows at all, and eventually its population drops to zero.
Paramecium aurelia and Paramecium caudatum grow well individually, but when they compete for the same resources, the P. aurelia outcompetes the P. caudatum .

Symbiosis

Symbiotic relationships are close, long-term interactions between individuals of different species. Symbioses may be commensal, in which one species benefits while the other is neither harmed nor benefited; mutualistic, in which both species benefit; or parasitic, in which the interaction harms one species and benefits the other.

Commensalism

A commensal relationship occurs when one species benefits from a close prolonged interaction, while the other neither benefits nor is harmed. Birds nesting in trees provide an example of a commensal relationship ( [link] ). The tree is not harmed by the presence of the nest among its branches. The nests are light and produce little strain on the structural integrity of the branch, and most of the leaves, which the tree uses to get energy by photosynthesis, are above the nest so they are unaffected. The bird, on the other hand, benefits greatly. If the bird had to nest in the open, its eggs and young would be vulnerable to predators. Many potential commensal relationships are difficult to identify because it is difficult to prove that one partner does not derive some benefit from the presence of the other.

Questions & Answers

how do you get the 2/50
Abba Reply
number of sport play by 50 student construct discrete data
Aminu Reply
width of the frangebany leaves on how to write a introduction
Theresa Reply
Solve the mean of variance
Veronica Reply
Step 1: Find the mean. To find the mean, add up all the scores, then divide them by the number of scores. ... Step 2: Find each score's deviation from the mean. ... Step 3: Square each deviation from the mean. ... Step 4: Find the sum of squares. ... Step 5: Divide the sum of squares by n – 1 or N.
kenneth
what is error
Yakuba Reply
Is mistake done to something
Vutshila
Hy
anas
hy
What is the life teble
anas
hy
Jibrin
statistics is the analyzing of data
Tajudeen Reply
what is statics?
Zelalem Reply
how do you calculate mean
Gloria Reply
diveving the sum if all values
Shaynaynay
let A1,A2 and A3 events be independent,show that (A1)^c, (A2)^c and (A3)^c are independent?
Fisaye Reply
what is statistics
Akhisani Reply
data collected all over the world
Shaynaynay
construct a less than and more than table
Imad Reply
The sample of 16 students is taken. The average age in the sample was 22 years with astandard deviation of 6 years. Construct a 95% confidence interval for the age of the population.
Aschalew Reply
Bhartdarshan' is an internet-based travel agency wherein customer can see videos of the cities they plant to visit. The number of hits daily is a normally distributed random variable with a mean of 10,000 and a standard deviation of 2,400 a. what is the probability of getting more than 12,000 hits? b. what is the probability of getting fewer than 9,000 hits?
Akshay Reply
Bhartdarshan'is an internet-based travel agency wherein customer can see videos of the cities they plan to visit. The number of hits daily is a normally distributed random variable with a mean of 10,000 and a standard deviation of 2,400. a. What is the probability of getting more than 12,000 hits
Akshay
1
Bright
Sorry i want to learn more about this question
Bright
Someone help
Bright
a= 0.20233 b=0.3384
Sufiyan
a
Shaynaynay
How do I interpret level of significance?
Mohd Reply
It depends on your business problem or in Machine Learning you could use ROC- AUC cruve to decide the threshold value
Shivam
how skewness and kurtosis are used in statistics
Owen Reply
yes what is it
Taneeya
Got questions? Join the online conversation and get instant answers!
Jobilize.com Reply

Get Jobilize Job Search Mobile App in your pocket Now!

Get it on Google Play Download on the App Store Now


Source:  OpenStax, Concepts of biology. OpenStax CNX. Feb 29, 2016 Download for free at http://cnx.org/content/col11487/1.9
Google Play and the Google Play logo are trademarks of Google Inc.

Notification Switch

Would you like to follow the 'Concepts of biology' conversation and receive update notifications?

Ask