<< Chapter < Page Chapter >> Page >

Law of segregation

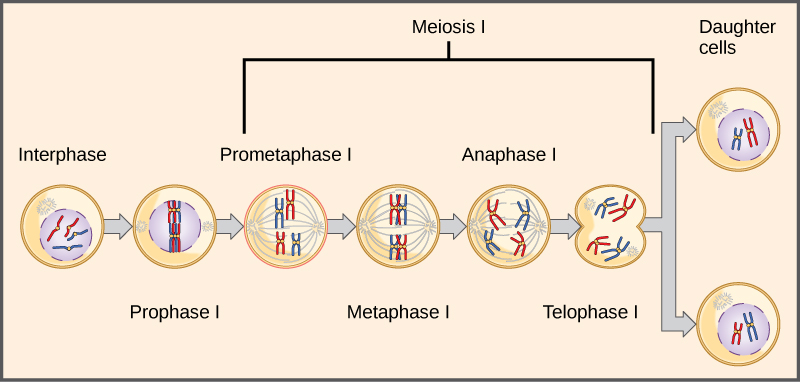
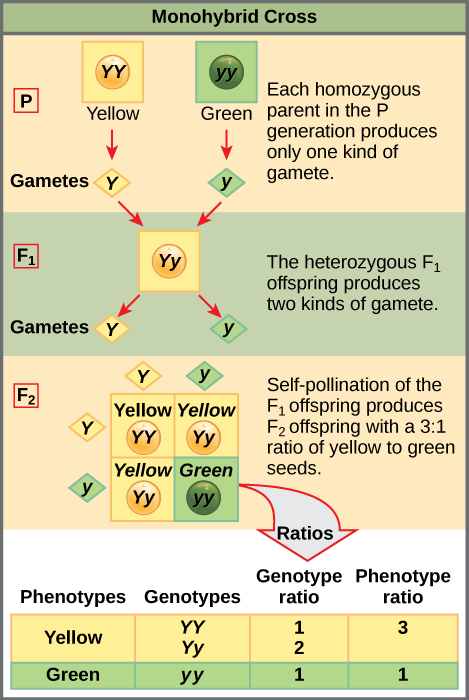
Observing that true-breeding pea plants with contrasting traits gave rise to F 1 generations that all expressed the dominant trait and F 2 generations that expressed the dominant and recessive traits in a 3:1 ratio, Mendel proposed the law of segregation    . This law states that paired unit factors (genes) must segregate equally into gametes such that offspring have an equal likelihood of inheriting either factor. For the F 2 generation of a monohybrid cross, the following three possible combinations of genotypes result: homozygous dominant, heterozygous, or homozygous recessive. Because heterozygotes could arise from two different pathways (receiving one dominant and one recessive allele from either parent), and because heterozygotes and homozygous dominant individuals are phenotypically identical, the law supports Mendel’s observed 3:1 phenotypic ratio. The equal segregation of alleles is the reason we can apply the Punnett square to accurately predict the offspring of parents with known genotypes. The physical basis of Mendel’s law of segregation is the first division of meiosis in which the homologous chromosomes with their different versions of each gene are segregated into daughter nuclei. This process was not understood by the scientific community during Mendel’s lifetime ( [link] ).

Homologous pairs of chromosomes line up at the metaphase plate during metaphase I of meiosis. The homologous chromosomes with their different versions of each gene are segregated into daughter nuclei.
The first division in meiosis is shown.

Test cross

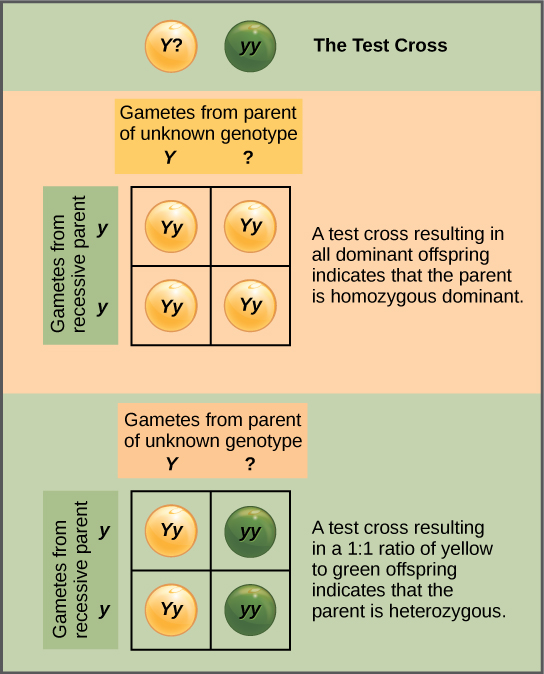
Beyond predicting the offspring of a cross between known homozygous or heterozygous parents, Mendel also developed a way to determine whether an organism that expressed a dominant trait was a heterozygote or a homozygote. Called the test cross    , this technique is still used by plant and animal breeders. In a test cross, the dominant-expressing organism is crossed with an organism that is homozygous recessive for the same characteristic. If the dominant-expressing organism is a homozygote, then all F 1 offspring will be heterozygotes expressing the dominant trait ( [link] ). Alternatively, if the dominant-expressing organism is a heterozygote, the F 1 offspring will exhibit a 1:1 ratio of heterozygotes and recessive homozygotes ( [link] ). The test cross further validates Mendel’s postulate that pairs of unit factors segregate equally.

In a test cross, a parent with a dominant phenotype but unknown genotype is crossed with a recessive parent. If the parent with the unknown phenotype is homozygous dominant, all the resulting offspring will have at least one dominant allele. If the parent with the unknown phenotype is heterozygous, 50 percent of the offspring will inherit a recessive allele from both parents and will have the recessive phenotype.
A test cross can be performed to determine whether an organism expressing a dominant trait is a homozygote or a heterozygote.

Art connection

This illustration shows a monohybrid cross. In the P generation, one parent has a dominant yellow phenotype and the genotype YY, and the other parent has the recessive green phenotype and the genotype yy. Each parent produces one kind of gamete, resulting in an F_{1} generation with a dominant yellow phenotype and the genotype Yy. Self-pollination of the F_{1} generation results in an F_{2} generation with a 3 to 1 ratio of yellow to green peas. One out of three of the yellow pea plants has a dominant genotype of YY, and 2 out of 3 has the heterozygous genotype Yy. The homozygous recessive plant has the green phenotype and the genotype yy.
This Punnett square shows the cross between plants with yellow seeds and green seeds. The cross between the true-breeding P plants produces F 1 heterozygotes that can be self-fertilized. The self-cross of the F 1 generation can be analyzed with a Punnett square to predict the genotypes of the F 2 generation. Given an inheritance pattern of dominant–recessive, the genotypic and phenotypic ratios can then be determined.

In pea plants, round peas ( R ) are dominant to wrinkled peas ( r ). You do a test cross between a pea plant with wrinkled peas (genotype rr ) and a plant of unknown genotype that has round peas. You end up with three plants, all which have round peas. From this data, can you tell if the parent plant is homozygous dominant or heterozygous?

Questions & Answers

differentiate between demand and supply giving examples
Lambiv Reply
differentiated between demand and supply using examples
Lambiv
what is labour ?
Lambiv
how will I do?
Venny Reply
how is the graph works?I don't fully understand
Rezat Reply
information
Eliyee
devaluation
Eliyee
t
WARKISA
hi guys good evening to all
Lambiv
multiple choice question
Aster Reply
appreciation
Eliyee
explain perfect market
Lindiwe Reply
In economics, a perfect market refers to a theoretical construct where all participants have perfect information, goods are homogenous, there are no barriers to entry or exit, and prices are determined solely by supply and demand. It's an idealized model used for analysis,
Ezea
What is ceteris paribus?
Shukri Reply
other things being equal
AI-Robot
When MP₁ becomes negative, TP start to decline. Extuples Suppose that the short-run production function of certain cut-flower firm is given by: Q=4KL-0.6K2 - 0.112 • Where is quantity of cut flower produced, I is labour input and K is fixed capital input (K-5). Determine the average product of lab
Kelo
Extuples Suppose that the short-run production function of certain cut-flower firm is given by: Q=4KL-0.6K2 - 0.112 • Where is quantity of cut flower produced, I is labour input and K is fixed capital input (K-5). Determine the average product of labour (APL) and marginal product of labour (MPL)
Kelo
yes,thank you
Shukri
Can I ask you other question?
Shukri
what is monopoly mean?
Habtamu Reply
What is different between quantity demand and demand?
Shukri Reply
Quantity demanded refers to the specific amount of a good or service that consumers are willing and able to purchase at a give price and within a specific time period. Demand, on the other hand, is a broader concept that encompasses the entire relationship between price and quantity demanded
Ezea
ok
Shukri
how do you save a country economic situation when it's falling apart
Lilia Reply
what is the difference between economic growth and development
Fiker Reply
Economic growth as an increase in the production and consumption of goods and services within an economy.but Economic development as a broader concept that encompasses not only economic growth but also social & human well being.
Shukri
production function means
Jabir
What do you think is more important to focus on when considering inequality ?
Abdisa Reply
any question about economics?
Awais Reply
sir...I just want to ask one question... Define the term contract curve? if you are free please help me to find this answer 🙏
Asui
it is a curve that we get after connecting the pareto optimal combinations of two consumers after their mutually beneficial trade offs
Awais
thank you so much 👍 sir
Asui
In economics, the contract curve refers to the set of points in an Edgeworth box diagram where both parties involved in a trade cannot be made better off without making one of them worse off. It represents the Pareto efficient allocations of goods between two individuals or entities, where neither p
Cornelius
In economics, the contract curve refers to the set of points in an Edgeworth box diagram where both parties involved in a trade cannot be made better off without making one of them worse off. It represents the Pareto efficient allocations of goods between two individuals or entities,
Cornelius
Suppose a consumer consuming two commodities X and Y has The following utility function u=X0.4 Y0.6. If the price of the X and Y are 2 and 3 respectively and income Constraint is birr 50. A,Calculate quantities of x and y which maximize utility. B,Calculate value of Lagrange multiplier. C,Calculate quantities of X and Y consumed with a given price. D,alculate optimum level of output .
Feyisa Reply
Answer
Feyisa
c
Jabir
the market for lemon has 10 potential consumers, each having an individual demand curve p=101-10Qi, where p is price in dollar's per cup and Qi is the number of cups demanded per week by the i th consumer.Find the market demand curve using algebra. Draw an individual demand curve and the market dema
Gsbwnw Reply
suppose the production function is given by ( L, K)=L¼K¾.assuming capital is fixed find APL and MPL. consider the following short run production function:Q=6L²-0.4L³ a) find the value of L that maximizes output b)find the value of L that maximizes marginal product
Abdureman
types of unemployment
Yomi Reply
What is the difference between perfect competition and monopolistic competition?
Mohammed
Got questions? Join the online conversation and get instant answers!
Jobilize.com Reply

Get Jobilize Job Search Mobile App in your pocket Now!

Get it on Google Play Download on the App Store Now


Source:  OpenStax, Concepts of biology. OpenStax CNX. Feb 29, 2016 Download for free at http://cnx.org/content/col11487/1.9
Google Play and the Google Play logo are trademarks of Google Inc.

Notification Switch

Would you like to follow the 'Concepts of biology' conversation and receive update notifications?

Ask