<< Chapter < Page Chapter >> Page >

Law of independent assortment

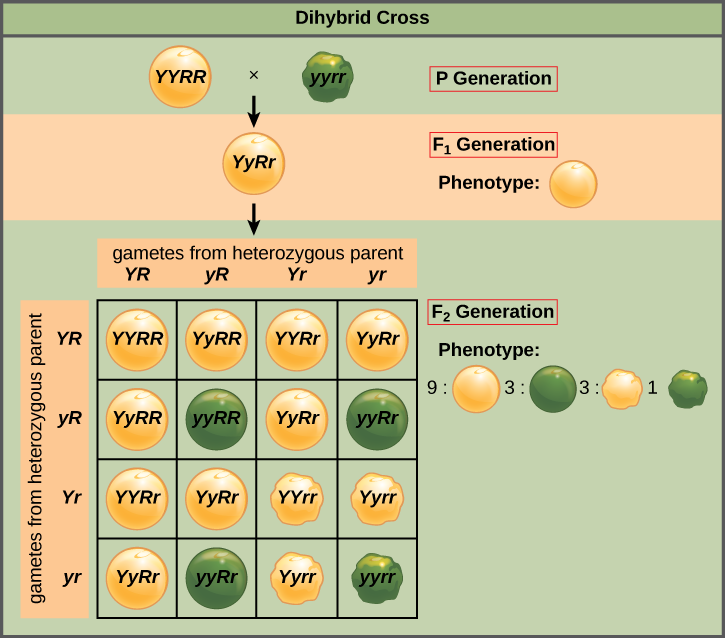
Mendel’s law of independent assortment    states that genes do not influence each other with regard to the sorting of alleles into gametes, and every possible combination of alleles for every gene is equally likely to occur. Independent assortment of genes can be illustrated by the dihybrid    cross, a cross between two true-breeding parents that express different traits for two characteristics. Consider the characteristics of seed color and seed texture for two pea plants, one that has wrinkled, green seeds ( rryy ) and another that has round, yellow seeds ( RRYY ). Because each parent is homozygous, the law of segregation indicates that the gametes for the wrinkled–green plant all are ry , and the gametes for the round–yellow plant are all RY . Therefore, the F 1 generation of offspring all are RrYy ( [link] ).

Art connection

This illustration shows a dihybrid cross between pea plants. In the P generation, a plant that has the homozygous dominant phenotype of yellow, round peas is crossed with a plant with the homozygous recessive phenotype of green, wrinkled peas. The resulting F_{1} offspring have a heterozygous genotype and yellow, round peas. Self-pollination of the F_{1} generation results in F_{2} offspring with a phenotypic ratio of 9:3:3:1 for round–yellow, round–green, wrinkled–yellow, and wrinkled–green peas, respectively.
A dihybrid cross in pea plants involves the genes for seed color and texture. The P cross produces F 1 offspring that are all heterozygous for both characteristics. The resulting 9:3:3:1 F 2 phenotypic ratio is obtained using a Punnett square.

In pea plants, purple flowers ( P ) are dominant to white ( p ), and yellow peas ( Y ) are dominant to green ( y ). What are the possible genotypes and phenotypes for a cross between PpYY and ppYy pea plants? How many squares would you need to complete a Punnett square analysis of this cross?

The gametes produced by the F 1 individuals must have one allele from each of the two genes. For example, a gamete could get an R allele for the seed shape gene and either a Y or a y allele for the seed color gene. It cannot get both an R and an r allele; each gamete can have only one allele per gene. The law of independent assortment states that a gamete into which an r allele is sorted would be equally likely to contain either a Y or a y allele. Thus, there are four equally likely gametes that can be formed when the RrYy heterozygote is self-crossed, as follows: RY , rY , Ry , and ry . Arranging these gametes along the top and left of a 4 × 4 Punnett square ( [link] ) gives us 16 equally likely genotypic combinations. From these genotypes, we find a phenotypic ratio of 9 round–yellow:3 round–green:3 wrinkled–yellow:1 wrinkled–green ( [link] ). These are the offspring ratios we would expect, assuming we performed the crosses with a large enough sample size.

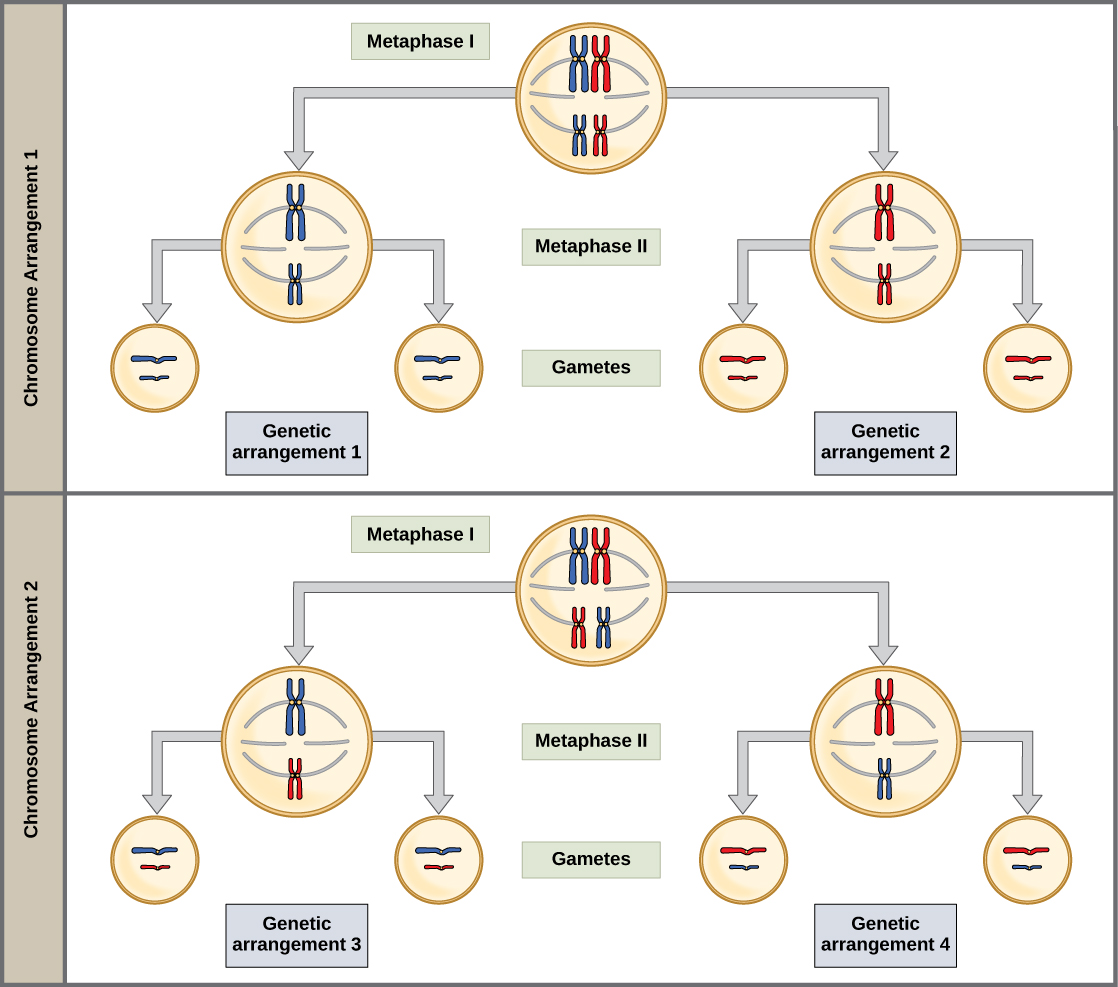
The physical basis for the law of independent assortment also lies in meiosis I, in which the different homologous pairs line up in random orientations. Each gamete can contain any combination of paternal and maternal chromosomes (and therefore the genes on them) because the orientation of tetrads on the metaphase plane is random ( [link] ).

Homologous pairs of chromosomes line up at the metaphase plate during metaphase I of meiosis. The homologous chromosomes, with their different versions of each gene, are randomly segregated into daughter nuclei, resulting in a variety of possible genetic arrangements.
The random segregation into daughter nuclei that happens during the first division in meiosis can lead to a variety of possible genetic arrangements.

Section summary

When true-breeding, or homozygous, individuals that differ for a certain trait are crossed, all of the offspring will be heterozygous for that trait. If the traits are inherited as dominant and recessive, the F 1 offspring will all exhibit the same phenotype as the parent homozygous for the dominant trait. If these heterozygous offspring are self-crossed, the resulting F 2 offspring will be equally likely to inherit gametes carrying the dominant or recessive trait, giving rise to offspring of which one quarter are homozygous dominant, half are heterozygous, and one quarter are homozygous recessive. Because homozygous dominant and heterozygous individuals are phenotypically identical, the observed traits in the F 2 offspring will exhibit a ratio of three dominant to one recessive.

Mendel postulated that genes (characteristics) are inherited as pairs of alleles (traits) that behave in a dominant and recessive pattern. Alleles segregate into gametes such that each gamete is equally likely to receive either one of the two alleles present in a diploid individual. In addition, genes are assorted into gametes independently of one another. That is, in general, alleles are not more likely to segregate into a gamete with a particular allele of another gene.

Art connections

[link] In pea plants, round peas ( R ) are dominant to wrinkled peas ( r ). You do a test cross between a pea plant with wrinkled peas (genotype rr ) and a plant of unknown genotype that has round peas. You end up with three plants, all which have round peas. From this data, can you tell if the parent plant is homozygous dominant or heterozygous?

[link] You cannot be sure if the plant is homozygous or heterozygous as the data set is too small: by random chance, all three plants might have acquired only the dominant gene even if the recessive one is present.

Got questions? Get instant answers now!

[link] In pea plants, purple flowers ( P ) are dominant to white ( p ), and yellow peas ( Y ) are dominant to green ( y ). What are the possible genotypes and phenotypes for a cross between PpYY and ppYy pea plants? How many squares would you need to complete a Punnett square analysis of this cross?

[link] The possible genotypes are PpYY , PpYy , ppYY , and ppYy . The former two genotypes would result in plants with purple flowers and yellow peas, while the latter two genotypes would result in plants with white flowers with yellow peas, for a 1:1 ratio of each phenotype. You only need a 2 × 2 Punnett square (four squares total) to do this analysis because two of the alleles are homozygous.

Got questions? Get instant answers now!

Questions & Answers

What are the factors that affect demand for a commodity
Florence Reply
differentiate between demand and supply giving examples
Lambiv Reply
differentiated between demand and supply using examples
Lambiv
what is labour ?
Lambiv
how will I do?
Venny Reply
how is the graph works?I don't fully understand
Rezat Reply
information
Eliyee
devaluation
Eliyee
t
WARKISA
hi guys good evening to all
Lambiv
multiple choice question
Aster Reply
appreciation
Eliyee
explain perfect market
Lindiwe Reply
In economics, a perfect market refers to a theoretical construct where all participants have perfect information, goods are homogenous, there are no barriers to entry or exit, and prices are determined solely by supply and demand. It's an idealized model used for analysis,
Ezea
What is ceteris paribus?
Shukri Reply
other things being equal
AI-Robot
When MP₁ becomes negative, TP start to decline. Extuples Suppose that the short-run production function of certain cut-flower firm is given by: Q=4KL-0.6K2 - 0.112 • Where is quantity of cut flower produced, I is labour input and K is fixed capital input (K-5). Determine the average product of lab
Kelo
Extuples Suppose that the short-run production function of certain cut-flower firm is given by: Q=4KL-0.6K2 - 0.112 • Where is quantity of cut flower produced, I is labour input and K is fixed capital input (K-5). Determine the average product of labour (APL) and marginal product of labour (MPL)
Kelo
yes,thank you
Shukri
Can I ask you other question?
Shukri
what is monopoly mean?
Habtamu Reply
What is different between quantity demand and demand?
Shukri Reply
Quantity demanded refers to the specific amount of a good or service that consumers are willing and able to purchase at a give price and within a specific time period. Demand, on the other hand, is a broader concept that encompasses the entire relationship between price and quantity demanded
Ezea
ok
Shukri
how do you save a country economic situation when it's falling apart
Lilia Reply
what is the difference between economic growth and development
Fiker Reply
Economic growth as an increase in the production and consumption of goods and services within an economy.but Economic development as a broader concept that encompasses not only economic growth but also social & human well being.
Shukri
production function means
Jabir
What do you think is more important to focus on when considering inequality ?
Abdisa Reply
any question about economics?
Awais Reply
sir...I just want to ask one question... Define the term contract curve? if you are free please help me to find this answer 🙏
Asui
it is a curve that we get after connecting the pareto optimal combinations of two consumers after their mutually beneficial trade offs
Awais
thank you so much 👍 sir
Asui
In economics, the contract curve refers to the set of points in an Edgeworth box diagram where both parties involved in a trade cannot be made better off without making one of them worse off. It represents the Pareto efficient allocations of goods between two individuals or entities, where neither p
Cornelius
In economics, the contract curve refers to the set of points in an Edgeworth box diagram where both parties involved in a trade cannot be made better off without making one of them worse off. It represents the Pareto efficient allocations of goods between two individuals or entities,
Cornelius
Suppose a consumer consuming two commodities X and Y has The following utility function u=X0.4 Y0.6. If the price of the X and Y are 2 and 3 respectively and income Constraint is birr 50. A,Calculate quantities of x and y which maximize utility. B,Calculate value of Lagrange multiplier. C,Calculate quantities of X and Y consumed with a given price. D,alculate optimum level of output .
Feyisa Reply
Answer
Feyisa
c
Jabir
the market for lemon has 10 potential consumers, each having an individual demand curve p=101-10Qi, where p is price in dollar's per cup and Qi is the number of cups demanded per week by the i th consumer.Find the market demand curve using algebra. Draw an individual demand curve and the market dema
Gsbwnw Reply
suppose the production function is given by ( L, K)=L¼K¾.assuming capital is fixed find APL and MPL. consider the following short run production function:Q=6L²-0.4L³ a) find the value of L that maximizes output b)find the value of L that maximizes marginal product
Abdureman
Got questions? Join the online conversation and get instant answers!
Jobilize.com Reply

Get Jobilize Job Search Mobile App in your pocket Now!

Get it on Google Play Download on the App Store Now


Source:  OpenStax, Concepts of biology. OpenStax CNX. Feb 29, 2016 Download for free at http://cnx.org/content/col11487/1.9
Google Play and the Google Play logo are trademarks of Google Inc.

Notification Switch

Would you like to follow the 'Concepts of biology' conversation and receive update notifications?

Ask