<< Chapter < Page Chapter >> Page >
mortality rate =  number of individuals dying number of individuals surviving  x 1000

For example, between ages three and four, 12 individuals die out of the 776 that were remaining from the original 1000 sheep. This number is then multiplied by 1000 to get the mortality rate per thousand.

mortality rate =  12 776  x 1000   15 .5

As can be seen from the mortality rate data (column D), a high death rate occurred when the sheep were between 6 and 12 months old, and then increased even more from 8 to 12 years old, after which there were few survivors. The data indicate that if a sheep in this population were to survive to age one, it could be expected to live another 7.7 years on average, as shown by the life expectancy numbers in column E.

This life table of Ovis dalli shows the number of deaths, number of survivors, mortality rate, and life expectancy at each age interval for the Dall mountain sheep.
Life Table of Dall Mountain Sheep Data Adapted from Edward S. Deevey, Jr., “Life Tables for Natural Populations of Animals,” The Quarterly Review of Biology 22, no. 4 (December 1947): 283-314.
Age interval (years) Number dying in age interval out of 1000 born Number surviving at beginning of age interval out of 1000 born Mortality rate per 1000 alive at beginning of age interval Life expectancy or mean lifetime remaining to those attaining age interval
0-0.5 54 1000 54.0 7.06
0.5-1 145 946 153.3 --
1-2 12 801 15.0 7.7
2-3 13 789 16.5 6.8
3-4 12 776 15.5 5.9
4-5 30 764 39.3 5.0
5-6 46 734 62.7 4.2
6-7 48 688 69.8 3.4
7-8 69 640 107.8 2.6
8-9 132 571 231.2 1.9
9-10 187 439 426.0 1.3
10-11 156 252 619.0 0.9
11-12 90 96 937.5 0.6
12-13 3 6 500.0 1.2
13-14 3 3 1000 0.7

Survivorship curves

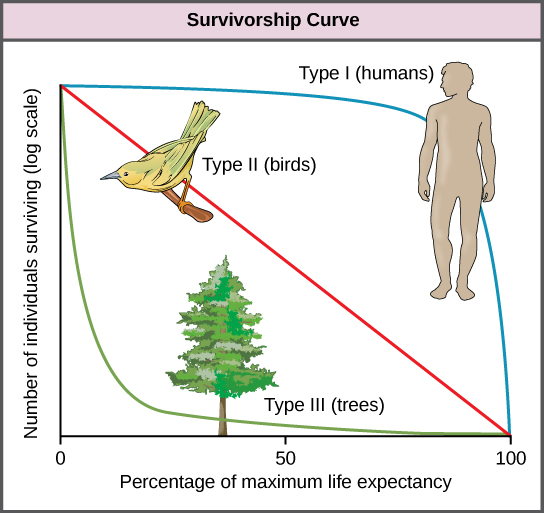
Another tool used by population ecologists is a survivorship curve    , which is a graph of the number of individuals surviving at each age interval plotted versus time (usually with data compiled from a life table). These curves allow us to compare the life histories of different populations ( [link] ). Humans and most primates exhibit a Type I survivorship curve because a high percentage of offspring survive their early and middle years—death occurs predominantly in older individuals. These types of species usually have small numbers of offspring at one time, and they give a high amount of parental care to them to ensure their survival. Birds are an example of an intermediate or Type II survivorship curve because birds die more or less equally at each age interval. These organisms also may have relatively few offspring and provide significant parental care. Trees, marine invertebrates, and most fishes exhibit a Type III survivorship curve because very few of these organisms survive their younger years; however, those that make it to an old age are more likely to survive for a relatively long period of time. Organisms in this category usually have a very large number of offspring, but once they are born, little parental care is provided. Thus these offspring are “on their own” and vulnerable to predation, but their sheer numbers assure the survival of enough individuals to perpetuate the species.

Graph plots the log of number of individuals surviving versus time. Three curves are shown, representing Type I, Type II, and Type III survivorship patterns. Birds exhibit a Type II survivorship curve, which decreases linearly with time. Humans show a Type I survivorship curve, which starts with a gentle slope that becomes increasingly steep with time. Trees show a Type III survivorship pattern, which starts with a steep slope that becomes less steep with time.
Survivorship curves show the distribution of individuals in a population according to age. Humans and most mammals have a Type I survivorship curve because death primarily occurs in the older years. Birds have a Type II survivorship curve, as death at any age is equally probable. Trees have a Type III survivorship curve because very few survive the younger years, but after a certain age, individuals are much more likely to survive.

Section summary

Populations are individuals of a species that live in a particular habitat. Ecologists measure characteristics of populations: size, density, dispersion pattern, age structure, and sex ratio. Life tables are useful to calculate life expectancies of individual population members. Survivorship curves show the number of individuals surviving at each age interval plotted versus time.

Art connections

[link] As this graph shows, population density typically decreases with increasing body size. Why do you think this is the case?

[link] Smaller animals require less food and other resources, so the environment can support more of them.

Got questions? Get instant answers now!

Questions & Answers

A golfer on a fairway is 70 m away from the green, which sits below the level of the fairway by 20 m. If the golfer hits the ball at an angle of 40° with an initial speed of 20 m/s, how close to the green does she come?
Aislinn Reply
cm
tijani
what is titration
John Reply
what is physics
Siyaka Reply
A mouse of mass 200 g falls 100 m down a vertical mine shaft and lands at the bottom with a speed of 8.0 m/s. During its fall, how much work is done on the mouse by air resistance
Jude Reply
Can you compute that for me. Ty
Jude
what is the dimension formula of energy?
David Reply
what is viscosity?
David
what is inorganic
emma Reply
what is chemistry
Youesf Reply
what is inorganic
emma
Chemistry is a branch of science that deals with the study of matter,it composition,it structure and the changes it undergoes
Adjei
please, I'm a physics student and I need help in physics
Adjanou
chemistry could also be understood like the sexual attraction/repulsion of the male and female elements. the reaction varies depending on the energy differences of each given gender. + masculine -female.
Pedro
A ball is thrown straight up.it passes a 2.0m high window 7.50 m off the ground on it path up and takes 1.30 s to go past the window.what was the ball initial velocity
Krampah Reply
2. A sled plus passenger with total mass 50 kg is pulled 20 m across the snow (0.20) at constant velocity by a force directed 25° above the horizontal. Calculate (a) the work of the applied force, (b) the work of friction, and (c) the total work.
Sahid Reply
you have been hired as an espert witness in a court case involving an automobile accident. the accident involved car A of mass 1500kg which crashed into stationary car B of mass 1100kg. the driver of car A applied his brakes 15 m before he skidded and crashed into car B. after the collision, car A s
Samuel Reply
can someone explain to me, an ignorant high school student, why the trend of the graph doesn't follow the fact that the higher frequency a sound wave is, the more power it is, hence, making me think the phons output would follow this general trend?
Joseph Reply
Nevermind i just realied that the graph is the phons output for a person with normal hearing and not just the phons output of the sound waves power, I should read the entire thing next time
Joseph
Follow up question, does anyone know where I can find a graph that accuretly depicts the actual relative "power" output of sound over its frequency instead of just humans hearing
Joseph
"Generation of electrical energy from sound energy | IEEE Conference Publication | IEEE Xplore" ***ieeexplore.ieee.org/document/7150687?reload=true
Ryan
what's motion
Maurice Reply
what are the types of wave
Maurice
answer
Magreth
progressive wave
Magreth
hello friend how are you
Muhammad Reply
fine, how about you?
Mohammed
hi
Mujahid
A string is 3.00 m long with a mass of 5.00 g. The string is held taut with a tension of 500.00 N applied to the string. A pulse is sent down the string. How long does it take the pulse to travel the 3.00 m of the string?
yasuo Reply
Who can show me the full solution in this problem?
Reofrir Reply
Got questions? Join the online conversation and get instant answers!
Jobilize.com Reply

Get Jobilize Job Search Mobile App in your pocket Now!

Get it on Google Play Download on the App Store Now


Source:  OpenStax, Biology. OpenStax CNX. Feb 29, 2016 Download for free at http://cnx.org/content/col11448/1.10
Google Play and the Google Play logo are trademarks of Google Inc.

Notification Switch

Would you like to follow the 'Biology' conversation and receive update notifications?

Ask