

| << Chapter < Page | Chapter >> Page > |
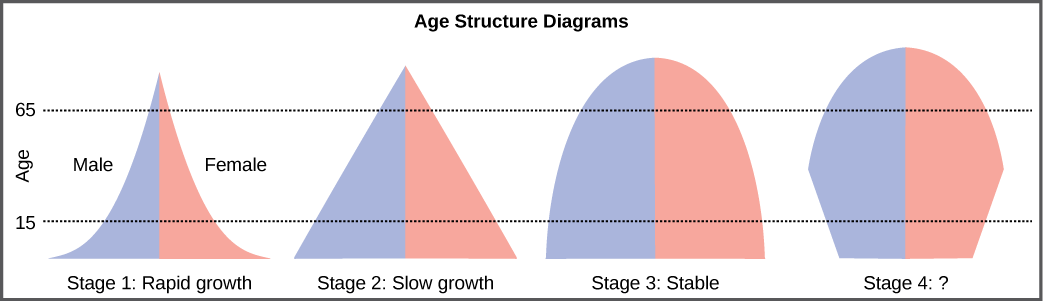
Age structure diagrams for rapidly growing, slow growing and stable populations are shown in stages 1 through 3. What type of population change do you think stage 4 represents?
Many dire predictions have been made about the world’s population leading to a major crisis called the “population explosion.” In the 1968 book The Population Bomb , biologist Dr. Paul R. Ehrlich wrote, “The battle to feed all of humanity is over. In the 1970s hundreds of millions of people will starve to death in spite of any crash programs embarked upon now. At this late date nothing can prevent a substantial increase in the world death rate.” Paul R. Erlich, prologue to The Population Bomb , (1968; repr., New York: Ballantine, 1970). While many critics view this statement as an exaggeration, the laws of exponential population growth are still in effect, and unchecked human population growth cannot continue indefinitely.
Efforts to control population growth led to the one-child policy in China, which used to include more severe consequences, but now imposes fines on urban couples who have more than one child. Due to the fact that some couples wish to have a male heir, many Chinese couples continue to have more than one child. The policy itself, its social impacts, and the effectiveness of limiting overall population growth are controversial. In spite of population control policies, the human population continues to grow. At some point the food supply may run out because of the subsequent need to produce more and more food to feed our population. The United Nations estimates that future world population growth may vary from 6 billion (a decrease) to 16 billion people by the year 2100. There is no way to know whether human population growth will moderate to the point where the crisis described by Dr. Ehrlich will be averted.
Another result of population growth is the endangerment of the natural environment. Many countries have attempted to reduce the human impact on climate change by reducing their emission of the greenhouse gas carbon dioxide. However, these treaties have not been ratified by every country, and many underdeveloped countries trying to improve their economic condition may be less likely to agree with such provisions if it means slower economic development. Furthermore, the role of human activity in causing climate change has become a hotly debated socio-political issue in some developed countries, including the United States. Thus, we enter the future with considerable uncertainty about our ability to curb human population growth and protect our environment.
Visit this website and select “Launch movie” for an animation discussing the global impacts of human population growth.
The world’s human population is growing at an exponential rate. Humans have increased the world’s carrying capacity through migration, agriculture, medical advances, and communication. The age structure of a population allows us to predict population growth. Unchecked human population growth could have dire long-term effects on our environment.
[link] Age structure diagrams for rapidly growing, slow growing and stable populations are shown in stages 1 through 3. What type of population change do you think stage 4 represents?
[link] Stage 4 represents a population that is decreasing.
Notification Switch
Would you like to follow the 'Biology' conversation and receive update notifications?

|
|
|
|
|

|
|

|
|

|
|

|
|

|
|

|
|

|
|

|
|

|
|

|