<< Chapter < Page Chapter >> Page >

Notice that when N is very small, ( K-N )/ K becomes close to K/K or 1, and the right side of the equation reduces to r max N , which means the population is growing exponentially and is not influenced by carrying capacity. On the other hand, when N is large, ( K-N )/ K come close to zero, which means that population growth will be slowed greatly or even stopped. Thus, population growth is greatly slowed in large populations by the carrying capacity K . This model also allows for the population of a negative population growth, or a population decline. This occurs when the number of individuals in the population exceeds the carrying capacity (because the value of (K-N)/K is negative).

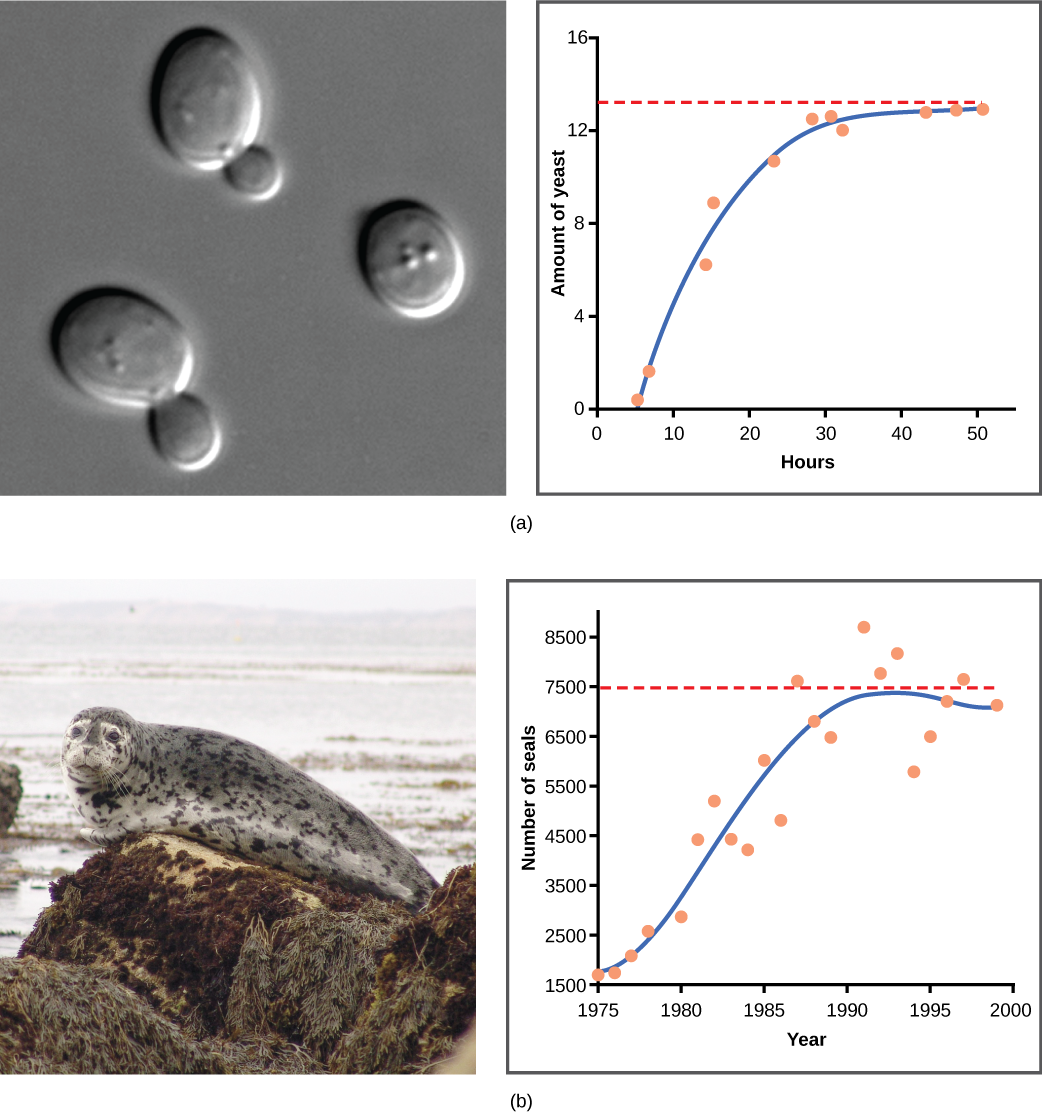
A graph of this equation yields an S-shaped curve ( [link] ), and it is a more realistic model of population growth than exponential growth. There are three different sections to an S-shaped curve. Initially, growth is exponential because there are few individuals and ample resources available. Then, as resources begin to become limited, the growth rate decreases. Finally, growth levels off at the carrying capacity of the environment, with little change in population size over time.

Role of intraspecific competition

The logistic model assumes that every individual within a population will have equal access to resources and, thus, an equal chance for survival. For plants, the amount of water, sunlight, nutrients, and the space to grow are the important resources, whereas in animals, important resources include food, water, shelter, nesting space, and mates.

In the real world, phenotypic variation among individuals within a population means that some individuals will be better adapted to their environment than others. The resulting competition between population members of the same species for resources is termed intraspecific competition     (intra- = “within”; -specific = “species”). Intraspecific competition for resources may not affect populations that are well below their carrying capacity—resources are plentiful and all individuals can obtain what they need. However, as population size increases, this competition intensifies. In addition, the accumulation of waste products can reduce an environment’s carrying capacity.

Examples of logistic growth

Yeast, a microscopic fungus used to make bread and alcoholic beverages, exhibits the classical S-shaped curve when grown in a test tube ( [link] a ). Its growth levels off as the population depletes the nutrients that are necessary for its growth. In the real world, however, there are variations to this idealized curve. Examples in wild populations include sheep and harbor seals ( [link] b ). In both examples, the population size exceeds the carrying capacity for short periods of time and then falls below the carrying capacity afterwards. This fluctuation in population size continues to occur as the population oscillates around its carrying capacity. Still, even with this oscillation, the logistic model is confirmed.
Art connection

Graph (a) plots amount of yeast versus time of growth in hours. The curve rises steeply, and then plateaus at the carrying capacity. Data points tightly follow the curve. Graph (b) plots the number of harbor seals versus time in years. Again, the curve rises steeply then plateaus at the carrying capacity, but this time there is much more scatter in the data. A micrograph of yeast cells, which are oval in shape, and a photo of a harbor seal are shown.
(a) Yeast grown in ideal conditions in a test tube show a classical S-shaped logistic growth curve, whereas (b) a natural population of seals shows real-world fluctuation.

If the major food source of the seals declines due to pollution or overfishing, which of the following would likely occur?

  1. The carrying capacity of seals would decrease, as would the seal population.
  2. The carrying capacity of seals would decrease, but the seal population would remain the same.
  3. The number of seal deaths would increase but the number of births would also increase, so the population size would remain the same.
  4. The carrying capacity of seals would remain the same, but the population of seals would decrease.

Section summary

Populations with unlimited resources grow exponentially, with an accelerating growth rate. When resources become limiting, populations follow a logistic growth curve. The population of a species will level off at the carrying capacity of its environment.

Art connections

[link] b If the major food source of the seals declines due to pollution or overfishing, which of the following would likely occur?

  1. The carrying capacity of seals would decrease, as would the seal population.
  2. The carrying capacity of seals would decrease, but the seal population would remain the same.
  3. The number of seal deaths would increase but the number of births would also increase, so the population size would remain the same.
  4. The carrying capacity of seals would remain the same, but the population of seals would decrease.

[link] b A

Got questions? Get instant answers now!

Questions & Answers

what does mean opportunity cost?
Aster Reply
what is poetive effect of population growth
Solomon Reply
what is inflation
Nasir Reply
what is demand
Eleni
what is economics
IMLAN Reply
economics theory describes individual behavior as the result of a process of optimization under constraints the objective to be reached being determined by
Kalkidan
Economics is a branch of social science that deal with How to wise use of resource ,s
Kassie
need
WARKISA
Economic Needs: In economics, needs are goods or services that are necessary for maintaining a certain standard of living. This includes things like healthcare, education, and transportation.
Kalkidan
What is demand and supply
EMPEROR Reply
deman means?
Alex
what is supply?
Alex
ex play supply?
Alex
Money market is a branch or segment of financial market where short-term debt instruments are traded upon. The instruments in this market includes Treasury bills, Bonds, Commercial Papers, Call money among other.
murana Reply
good
Kayode
what is money market
umar Reply
Examine the distinction between theory of comparative cost Advantage and theory of factor proportion
Fatima Reply
What is inflation
Bright Reply
a general and ongoing rise in the level of prices in an economy
AI-Robot
What are the factors that affect demand for a commodity
Florence Reply
price
Kenu
differentiate between demand and supply giving examples
Lambiv Reply
differentiated between demand and supply using examples
Lambiv
what is labour ?
Lambiv
how will I do?
Venny Reply
how is the graph works?I don't fully understand
Rezat Reply
information
Eliyee
devaluation
Eliyee
t
WARKISA
hi guys good evening to all
Lambiv
multiple choice question
Aster Reply
appreciation
Eliyee
explain perfect market
Lindiwe Reply
In economics, a perfect market refers to a theoretical construct where all participants have perfect information, goods are homogenous, there are no barriers to entry or exit, and prices are determined solely by supply and demand. It's an idealized model used for analysis,
Ezea
Got questions? Join the online conversation and get instant answers!
Jobilize.com Reply

Get Jobilize Job Search Mobile App in your pocket Now!

Get it on Google Play Download on the App Store Now


Source:  OpenStax, Biology. OpenStax CNX. Feb 29, 2016 Download for free at http://cnx.org/content/col11448/1.10
Google Play and the Google Play logo are trademarks of Google Inc.

Notification Switch

Would you like to follow the 'Biology' conversation and receive update notifications?

Ask