<< Chapter < Page Chapter >> Page >

The faint, red, main-sequence stars are not the stars of the most extreme densities, however. The white dwarfs, at the lower-left corner of the H–R diagram, have densities many times greater still.

The white dwarfs

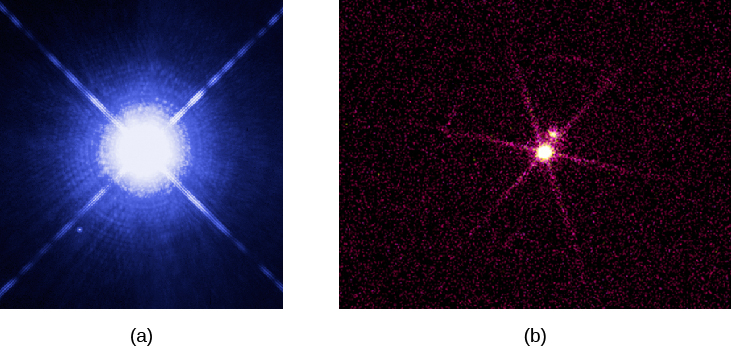
The first white dwarf    star was detected in 1862. Called Sirius B, it forms a binary system with Sirius A, the brightest-appearing star in the sky. It eluded discovery and analysis for a long time because its faint light tends to be lost in the glare of nearby Sirius A ( [link] ). (Since Sirius is often called the Dog Star—being the brightest star in the constellation of Canis Major, the big dog—Sirius B is sometimes nicknamed the Pup.)

Two views of sirius and its white dwarf companion.

Two Views of Sirius and Its White Dwarf Companion. (a) A visible light image taken by the Hubble Space Telescope. Sirius B is the faint speck in the lower left had quadrant of the image, and nearly lost in the glare of bright Sirius A. (b) X-ray image from the Chandra X-ray telescope. Sirius B is much brighter in X-rays and is the bright object at the center of the image. Above and slightly to the right is Sirius A.
(a) The (visible light) image, taken with the Hubble Space Telescope, shows bright Sirius A, and, below it and off to its left, faint Sirius B. (b) This image of the Sirius star system was taken with the Chandra X-Ray Telescope. Now, the bright object is the white dwarf companion, Sirius B. Sirius A is the faint object above it; what we are seeing from Sirius is probably not actually X-ray radiation but rather ultraviolet light that has leaked into the detector. Note that the ultraviolet intensities of these two objects are completely reversed from the situation in visible light because Sirius B is hotter and emits more higher-frequency radiation. (credit a: modification of work by NASA, H.E. Bond and E. Nelan (Space Telescope Science Institute), M. Barstow and M. Burleigh (University of Leicester) and J.B. Holberg (University of Arizona); credit b: modification of work by NASA/SAO/CXC)

We have now found thousands of white dwarfs. [link] shows that about 7% of the true stars (spectral types O–M) in our local neighborhood are white dwarfs. A good example of a typical white dwarf is the nearby star 40 Eridani B. Its surface temperature is a relatively hot 12,000 K, but its luminosity is only 1/275 L Sun . Calculations show that its radius is only 1.4% of the Sun’s, or about the same as that of Earth, and its volume is 2.5 × 10 –6 that of the Sun. Its mass, however, is 0.43 times the Sun’s mass, just a little less than half. To fit such a substantial mass into so tiny a volume, the star’s density must be about 170,000 times the density of the Sun, or more than 200,000 g/cm 3 . A teaspoonful of this material would have a mass of some 50 tons! At such enormous densities, matter cannot exist in its usual state; we will examine the particular behavior of this type of matter in The Death of Stars . For now, we just note that white dwarfs are dying stars, reaching the end of their productive lives and ready for their stories to be over.

The British astrophysicist (and science popularizer) Arthur Eddington (1882–1944) described the first known white dwarf this way:

The message of the companion of Sirius , when decoded, ran: “I am composed of material three thousand times denser than anything you’ve ever come across. A ton of my material would be a little nugget you could put in a matchbox.” What reply could one make to something like that? Well, the reply most of us made in 1914 was, “Shut up; don’t talk nonsense.”

Questions & Answers

differentiate between demand and supply giving examples
Lambiv Reply
differentiated between demand and supply using examples
Lambiv
what is labour ?
Lambiv
how will I do?
Venny Reply
how is the graph works?I don't fully understand
Rezat Reply
information
Eliyee
devaluation
Eliyee
t
WARKISA
hi guys good evening to all
Lambiv
multiple choice question
Aster Reply
appreciation
Eliyee
explain perfect market
Lindiwe Reply
In economics, a perfect market refers to a theoretical construct where all participants have perfect information, goods are homogenous, there are no barriers to entry or exit, and prices are determined solely by supply and demand. It's an idealized model used for analysis,
Ezea
What is ceteris paribus?
Shukri Reply
other things being equal
AI-Robot
When MP₁ becomes negative, TP start to decline. Extuples Suppose that the short-run production function of certain cut-flower firm is given by: Q=4KL-0.6K2 - 0.112 • Where is quantity of cut flower produced, I is labour input and K is fixed capital input (K-5). Determine the average product of lab
Kelo
Extuples Suppose that the short-run production function of certain cut-flower firm is given by: Q=4KL-0.6K2 - 0.112 • Where is quantity of cut flower produced, I is labour input and K is fixed capital input (K-5). Determine the average product of labour (APL) and marginal product of labour (MPL)
Kelo
yes,thank you
Shukri
Can I ask you other question?
Shukri
what is monopoly mean?
Habtamu Reply
What is different between quantity demand and demand?
Shukri Reply
Quantity demanded refers to the specific amount of a good or service that consumers are willing and able to purchase at a give price and within a specific time period. Demand, on the other hand, is a broader concept that encompasses the entire relationship between price and quantity demanded
Ezea
ok
Shukri
how do you save a country economic situation when it's falling apart
Lilia Reply
what is the difference between economic growth and development
Fiker Reply
Economic growth as an increase in the production and consumption of goods and services within an economy.but Economic development as a broader concept that encompasses not only economic growth but also social & human well being.
Shukri
production function means
Jabir
What do you think is more important to focus on when considering inequality ?
Abdisa Reply
any question about economics?
Awais Reply
sir...I just want to ask one question... Define the term contract curve? if you are free please help me to find this answer 🙏
Asui
it is a curve that we get after connecting the pareto optimal combinations of two consumers after their mutually beneficial trade offs
Awais
thank you so much 👍 sir
Asui
In economics, the contract curve refers to the set of points in an Edgeworth box diagram where both parties involved in a trade cannot be made better off without making one of them worse off. It represents the Pareto efficient allocations of goods between two individuals or entities, where neither p
Cornelius
In economics, the contract curve refers to the set of points in an Edgeworth box diagram where both parties involved in a trade cannot be made better off without making one of them worse off. It represents the Pareto efficient allocations of goods between two individuals or entities,
Cornelius
Suppose a consumer consuming two commodities X and Y has The following utility function u=X0.4 Y0.6. If the price of the X and Y are 2 and 3 respectively and income Constraint is birr 50. A,Calculate quantities of x and y which maximize utility. B,Calculate value of Lagrange multiplier. C,Calculate quantities of X and Y consumed with a given price. D,alculate optimum level of output .
Feyisa Reply
Answer
Feyisa
c
Jabir
the market for lemon has 10 potential consumers, each having an individual demand curve p=101-10Qi, where p is price in dollar's per cup and Qi is the number of cups demanded per week by the i th consumer.Find the market demand curve using algebra. Draw an individual demand curve and the market dema
Gsbwnw Reply
suppose the production function is given by ( L, K)=L¼K¾.assuming capital is fixed find APL and MPL. consider the following short run production function:Q=6L²-0.4L³ a) find the value of L that maximizes output b)find the value of L that maximizes marginal product
Abdureman
types of unemployment
Yomi Reply
What is the difference between perfect competition and monopolistic competition?
Mohammed
Got questions? Join the online conversation and get instant answers!
Jobilize.com Reply

Get Jobilize Job Search Mobile App in your pocket Now!

Get it on Google Play Download on the App Store Now


Source:  OpenStax, Astronomy. OpenStax CNX. Apr 12, 2017 Download for free at http://cnx.org/content/col11992/1.13
Google Play and the Google Play logo are trademarks of Google Inc.

Notification Switch

Would you like to follow the 'Astronomy' conversation and receive update notifications?

Ask