<< Chapter < Page Chapter >> Page >

So the star becomes simultaneously more luminous and cooler. On the H–R diagram, the star therefore leaves the main-sequence band and moves upward (brighter) and to the right (cooler surface temperature). Over time, massive stars become red supergiants, and lower-mass stars like the Sun become red giants. (We first discussed such giant stars in The Stars: A Celestial Census ; here we see how such “swollen” stars originate.) You might also say that these stars have “split personalities”: their cores are contracting while their outer layers are expanding. (Note that red giant stars do not actually look deep red; their colors are more like orange or orange-red.)

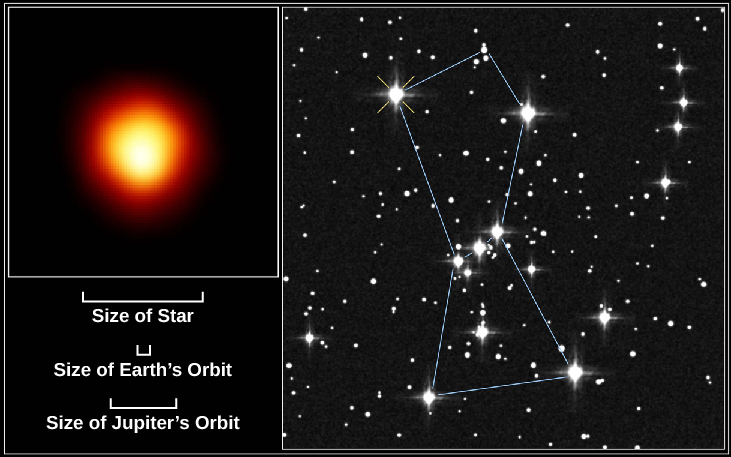
Just how different are these red giants and supergiants from a main-sequence star? [link] compares the Sun with the red supergiant Betelgeuse , which is visible above Orion’s belt as the bright red star that marks the hunter’s armpit. Relative to the Sun, this supergiant has a much larger radius, a much lower average density, a cooler surface, and a much hotter core.

Comparing a Supergiant with the Sun
Property Sun Betelgeuse
Mass (2 × 10 33 g) 1 16
Radius (km) 700,000 500,000,000
Surface temperature (K) 5,800 3,600
Core temperature (K) 15,000,000 160,000,000
Luminosity (4 × 10 26 W) 1 46,000
Average density (g/cm 3 ) 1.4 1.3 × 10 –7
Age (millions of years) 4,500 10

Red giants can become so large that if we were to replace the Sun with one of them, its outer atmosphere would extend to the orbit of Mars or even beyond ( [link] ). This is the next stage in the life of a star as it moves (to continue our analogy to human lives) from its long period of “youth” and “adulthood” to “old age.” (After all, many human beings today also see their outer layers expand a bit as they get older.) By considering the relative ages of the Sun and Betelgeuse, we can also see that the idea that “bigger stars die faster” is indeed true here. Betelgeuse is a mere 10 million years old, which is relatively young compared with our Sun’s 4.5 billion years, but it is already nearing its death throes as a red supergiant.

Betelgeuse.

Direct Image of the Star Betelgeuse. In this figure the H S T image of Betelgeuse is presented in the inset in the upper left of this image where the reddish, extended atmosphere surrounds the brighter, yellow core. Below the inset is a list of relative scales based on the image. At the top the “Size of Star” is indicated with a bar the width of Betelgeuse in the image. At the center the “Size of Earth’s Orbit” is shown with a much smaller bar. Finally, at the bottom, the “Size of Jupiter’s Orbit” is also shown with a bar. Both the orbits of Earth and Jupiter fit comfortably within the size of Betelgeuse. The right hand panel shows the full constellation of Orion, with Betelgeuse indicated at the upper left of the image.
Betelgeuse is in the constellation Orion, the hunter; in the right image, it is marked with a yellow “X” near the top left. In the left image, we see it in ultraviolet with the Hubble Space Telescope, in the first direct image ever made of the surface of another star. As shown by the scale at the bottom, Betelgeuse has an extended atmosphere so large that, if it were at the center of our solar system, it would stretch past the orbit of Jupiter. (credit: Modification of work by Andrea Dupree (Harvard-Smithsonian CfA), Ronald Gilliland (STScI), NASA and ESA)

Models for evolution to the giant stage

As we discussed earlier, astronomers can construct computer models of stars with different masses and compositions to see how stars change throughout their lives. [link] , which is based on theoretical calculations by University of Illinois astronomer Icko Iben, shows an H–R diagram with several tracks of evolution from the main sequence to the giant stage. Tracks are shown for stars with different masses (from 0.5 to 15 times the mass of our Sun) and with chemical compositions similar to that of the Sun. The red line is the initial or zero-age main sequence. The numbers along the tracks indicate the time, in years, required for each star to reach those points in their evolution after leaving the main sequence. Once again, you can see that the more massive a star is, the more quickly it goes through each stage in its life.

Evolutionary tracks of stars of different masses.

Evolutionary Tracks of Stars of Different Masses. In this plot the vertical axis is labeled “Luminosity (LSun)” and goes from 10-2 at the bottom to over 104 at the top. The horizontal axis is labeled “Surface Temperature (K)” and goes from 25,000 on the left to 4,000 on the right. The “Zero-age main sequence” is drawn as a diagonal red line beginning above L = 104 at the upper left of the image down to T ~ 4000 at the lower right. Six evolutionary tracks are drawn. Beginning at the top, a star of “15 solar masses” is plotted. It leaves the main sequence above L ~ 104 and T ~ 25,000. The track moves rightward across the top of the plot. The star maintains a relatively constant luminosity, but its surface temperature decreases with time. At “1.01 × 10⁷” years its temperature is about 20,000 K. At “1.11 × 10⁷” years it has fallen to about 15,000 K. At “1.19 × 10⁷” years T is about 9000 K, and the track ends at “1.2 × 10⁷” years near 4000 K. Next, a star of “5 solar masses” is plotted beginning near L ~ 103, where it leaves the main sequence. The star maintains a relatively constant luminosity, but its surface temperature decreases with time. At “6.55 × 10⁷” years its temperature is about 12,000 K. but its surface temperature decreases with time. At “2.39 × 10⁷” years it has fallen to about 5000 K. Then the luminosity rises slightly to the final plotted point at “7.02 × 10⁷” years near 4000 K. Next, a star of “3 solar masses” leaves the main sequence near L = 102 and 15,000 K. After “2.21 × 10⁸” years its temperature has fallen to near 11,000 K. After “2.46 × 10⁸” years its temperature has dropped to near 6000 K. Then, its luminosity increases by about a factor of ten where its curve ends at “2.51 × 10⁷” years and 5000 K. Next, a star of “1.5 solar masses” leaves the main sequence near L = 30 and 9000 K. After “1.55 × 10⁹” years its temperature has fallen to near 7500 K. After “2.09 × 10⁹” years, its temperature has dropped to near 5000 K. Then, its luminosity increases by about a factor of one hundred where its curve ends at “2.39 × 10⁹” years and 4000 K. Next, a star of “1 solar mass” leaves the main sequence at L = 1 and 5700 K. After “7 × 10⁹” years its temperature is nearly the same, but its luminosity has increased slightly. After “10.4 × 10⁹” years, its temperature has dropped to near 5000 K, and its luminosity has increased about 20 times. Then, its luminosity steadily increases to where its curve ends at “11.4 × 10⁹” years, L ~ 103 and T ~ 4000 K. Finally, a “0.5 solar mass” star is partially plotted. Its curve begins at L ~ 10-1 near T ~ 5000. Its curve is a short arrow pointing upward as its evolutionary timescale is too great for this diagram.
The solid black lines show the predicted evolution from the main sequence through the red giant or supergiant stage on the H–R diagram. Each track is labeled with the mass of the star it is describing. The numbers show how many years each star takes to become a giant after leaving the main sequence. The red line is the zero-age main sequence.

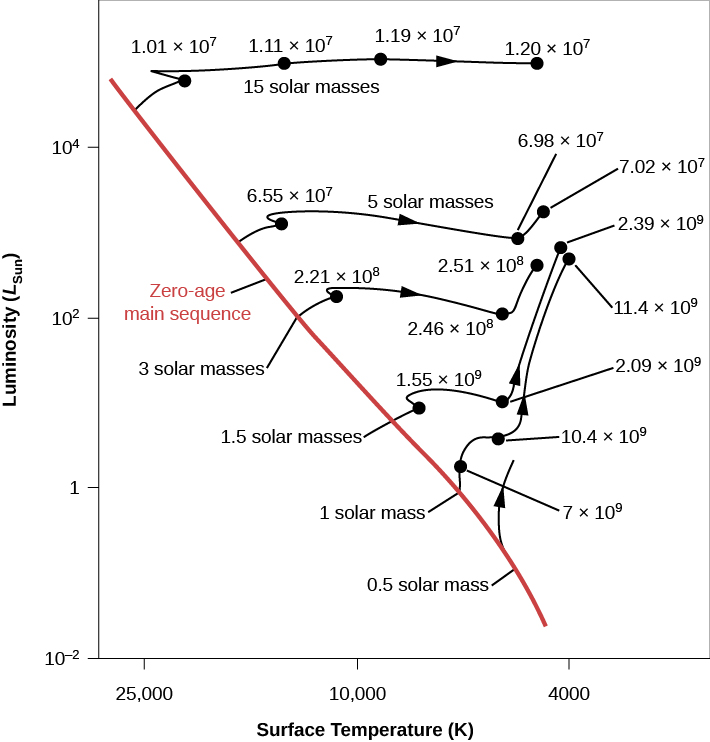
Note that the most massive star in this diagram has a mass similar to that of Betelgeuse , and so its evolutionary track shows approximately the history of Betelgeuse. The track for a 1-solar-mass star shows that the Sun is still in the main-sequence phase of evolution, since it is only about 4.5 billion years old. It will be billions of years before the Sun begins its own “climb” away from the main sequence—the expansion of its outer layers that will make it a red giant.

Key concepts and summary

When stars first begin to fuse hydrogen to helium, they lie on the zero-age main sequence. The amount of time a star spends in the main-sequence stage depends on its mass. More massive stars complete each stage of evolution more quickly than lower-mass stars. The fusion of hydrogen to form helium changes the interior composition of a star, which in turn results in changes in its temperature, luminosity, and radius. Eventually, as stars age, they evolve away from the main sequence to become red giants or supergiants. The core of a red giant is contracting, but the outer layers are expanding as a result of hydrogen fusion in a shell outside the core. The star gets larger, redder, and more luminous as it expands and cools.

Questions & Answers

how does the planets on our solar system orbit
cheten Reply
how many Messier objects are there in space
satish Reply
did you g8ve certificate
Richard Reply
what are astronomy
Issan Reply
Astronomy (from Ancient Greek ἀστρονομία (astronomía) 'science that studies the laws of the stars') is a natural science that studies celestial objects and phenomena. It uses mathematics, physics, and chemistry in order to explain their origin and evolution.
Rafael
vjuvu
Elgoog
what is big bang theory?
Rosemary
what type of activity astronomer do?
Rosemary
No
Richard
the big bang theory is a theory which states that all matter was compressed together in one place the matter got so unstable it exploded releasing All its contents in the form of hydrogen
Roaul
I want to be an astronomer. That's my dream
Astrit
Who named the the whole galaxy?
Shola Reply
solar Univers
GPOWER
what is space
Richard
what is the dark matter
Richard
what are the factors upon which the atmosphere is stratified
Nicholas Reply
is the big bang the sun
Folakemi Reply
no
Sokak
bigbang is the beginning of the universe
Sokak
but thats just a theory
Sokak
nothing will happen, don't worry brother.
Vansh
what does comet means
GANGAIN Reply
these are Rocky substances between mars and jupiter
GANGAIN
Comets are cosmic snowballs of frozen gases , rock and dust that orbit the sun. They are mostly found between the orbits of Venus and Mercury.
Aarya
hllo
John
hi
John
qt rrt
John
r u there
John
hey can anyone guide me abt international astronomy olympiad
sahil
how can we learn right and true ?
Govinda Reply
why the moon is always appear in an elliptical shape
Gatjuol Reply
Because when astroid hit the Earth then a piece of elliptical shape of the earth was separated which is now called moon.
Hemen
what's see level?
lidiya Reply
Did you mean eye sight or sea level
Minal
oh sorry it's sea level
lidiya
according to the theory of astronomers why the moon is always appear in an elliptical orbit?
Gatjuol
hi !!! I am new in astronomy.... I have so many questions in mind .... all of scientists of the word they just give opinion only. but they never think true or false ... i respect all of them... I believes whole universe depending on true ...থিউরি
Govinda
hello
Jackson
hi
Elyana
we're all stars and galaxies a part of sun. how can science prove thx with respect old ancient times picture or books..or anything with respect to present time .but we r a part of that universe
w astronomy and cosmology!
Michele
another theory of universe except big ban
Albash Reply
how was universe born
Asmit Reply
there many theory to born universe but what is the reality of big bang theory to born universe
Asmit
what is the exact value of π?
Nagalakshmi
by big bang
universal
there are many theories regarding this it's on you believe any theory that you think is true ex. eternal inflation theory, oscillation model theory, multiple universe theory the big bang theory etc.
Aarya
I think after Big Bang!
Michele
from where on earth could u observe all the stars during the during the course of an year
Karuna Reply
I think it couldn't possible on earth
Nagalakshmi
in this time i don't Know
Michele
is that so. the question was in the end of this chapter
Karuna
in theory, you could see them all from the equator (though over the course of a year, not at pne time). stars are measured in "declination", which is how far N or S of the equator (90* to -90*). Polaris is the North star, and is ALMOST 90* (+89*). So it would just barely creep over the horizon.
Christopher
Practice Key Terms 1

Get Jobilize Job Search Mobile App in your pocket Now!

Get it on Google Play Download on the App Store Now


Source:  OpenStax, Astronomy. OpenStax CNX. Apr 12, 2017 Download for free at http://cnx.org/content/col11992/1.13
Google Play and the Google Play logo are trademarks of Google Inc.

Notification Switch

Would you like to follow the 'Astronomy' conversation and receive update notifications?

Ask