<< Chapter < Page Chapter >> Page >

Hubble’s law

The profound implications of Slipher’s work became apparent only during the 1920s. Georges Lemaître was a Belgian priest and a trained astronomer. In 1927, he published a paper in French in an obscure Belgian journal in which he suggested that we live in an expanding universe. The title of the paper (translated into English) is “A Homogenous Universe of Constant Mass and Growing Radius Accounting for the Radial Velocity of Extragalactic Nebulae.” Lemaître had discovered that Einstein’s equations of relativity were consistent with an expanding universe (as had the Russian scientist Alexander Friedmann independently in 1922). Lemaître then went on to use Slipher’s data to support the hypothesis that the universe actually is expanding and to estimate the rate of expansion. Initially, scientists paid little attention to this paper, perhaps because the Belgian journal was not widely available.

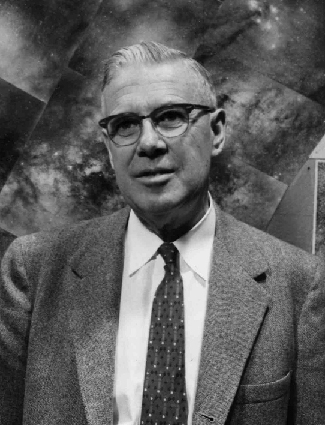
In the meantime, Hubble was making observations of galaxies with the 2.5-meter telescope on Mt. Wilson, which was then the world’s largest. Hubble carried out the key observations in collaboration with a remarkable man, Milton Humason , who dropped out of school in the eighth grade and began his astronomical career by driving a mule train up the trail on Mount Wilson to the observatory ( [link] ). In those early days, supplies had to be brought up that way; even astronomers hiked up to the mountaintop for their turns at the telescope. Humason became interested in the work of the astronomers and, after marrying the daughter of the observatory’s electrician, took a job as janitor there. After a time, he became a night assistant, helping the astronomers run the telescope and record data. Eventually, he made such a mark that he became a full astronomer at the observatory.

Milton humason (1891–1972).

Photograph of Milton Humason.
Humason was Hubble’s collaborator on the great task of observing, measuring, and classifying the characteristics of many galaxies. (credit: Caltech Archives)

By the late 1920s, Humason was collaborating with Hubble by photographing the spectra of faint galaxies with the 2.5-meter telescope. (By then, there was no question that the spiral nebulae were in fact galaxies.) Hubble had found ways to improve the accuracy of the estimates of distances to spiral galaxies, and he was able to measure much fainter and more distant galaxies than Slipher could observe with his much-smaller telescope. When Hubble laid his own distance estimates next to measurements of the recession velocities (the speed with which the galaxies were moving away), he found something stunning: there was a relationship between distance and velocity for galaxies. The more distant the galaxy, the faster it was receding from us .

In 1931, Hubble and Humason jointly published the seminal paper where they compared distances and velocities of remote galaxies moving away from us at speeds as high as 20,000 kilometers per second and were able to show that the recession velocities of galaxies are directly proportional to their distances from us ( [link] ), just as Lemaître had suggested.

Questions & Answers

What are the factors that affect demand for a commodity
Florence Reply
differentiate between demand and supply giving examples
Lambiv Reply
differentiated between demand and supply using examples
Lambiv
what is labour ?
Lambiv
how will I do?
Venny Reply
how is the graph works?I don't fully understand
Rezat Reply
information
Eliyee
devaluation
Eliyee
t
WARKISA
hi guys good evening to all
Lambiv
multiple choice question
Aster Reply
appreciation
Eliyee
explain perfect market
Lindiwe Reply
In economics, a perfect market refers to a theoretical construct where all participants have perfect information, goods are homogenous, there are no barriers to entry or exit, and prices are determined solely by supply and demand. It's an idealized model used for analysis,
Ezea
What is ceteris paribus?
Shukri Reply
other things being equal
AI-Robot
When MP₁ becomes negative, TP start to decline. Extuples Suppose that the short-run production function of certain cut-flower firm is given by: Q=4KL-0.6K2 - 0.112 • Where is quantity of cut flower produced, I is labour input and K is fixed capital input (K-5). Determine the average product of lab
Kelo
Extuples Suppose that the short-run production function of certain cut-flower firm is given by: Q=4KL-0.6K2 - 0.112 • Where is quantity of cut flower produced, I is labour input and K is fixed capital input (K-5). Determine the average product of labour (APL) and marginal product of labour (MPL)
Kelo
yes,thank you
Shukri
Can I ask you other question?
Shukri
what is monopoly mean?
Habtamu Reply
What is different between quantity demand and demand?
Shukri Reply
Quantity demanded refers to the specific amount of a good or service that consumers are willing and able to purchase at a give price and within a specific time period. Demand, on the other hand, is a broader concept that encompasses the entire relationship between price and quantity demanded
Ezea
ok
Shukri
how do you save a country economic situation when it's falling apart
Lilia Reply
what is the difference between economic growth and development
Fiker Reply
Economic growth as an increase in the production and consumption of goods and services within an economy.but Economic development as a broader concept that encompasses not only economic growth but also social & human well being.
Shukri
production function means
Jabir
What do you think is more important to focus on when considering inequality ?
Abdisa Reply
any question about economics?
Awais Reply
sir...I just want to ask one question... Define the term contract curve? if you are free please help me to find this answer 🙏
Asui
it is a curve that we get after connecting the pareto optimal combinations of two consumers after their mutually beneficial trade offs
Awais
thank you so much 👍 sir
Asui
In economics, the contract curve refers to the set of points in an Edgeworth box diagram where both parties involved in a trade cannot be made better off without making one of them worse off. It represents the Pareto efficient allocations of goods between two individuals or entities, where neither p
Cornelius
In economics, the contract curve refers to the set of points in an Edgeworth box diagram where both parties involved in a trade cannot be made better off without making one of them worse off. It represents the Pareto efficient allocations of goods between two individuals or entities,
Cornelius
Suppose a consumer consuming two commodities X and Y has The following utility function u=X0.4 Y0.6. If the price of the X and Y are 2 and 3 respectively and income Constraint is birr 50. A,Calculate quantities of x and y which maximize utility. B,Calculate value of Lagrange multiplier. C,Calculate quantities of X and Y consumed with a given price. D,alculate optimum level of output .
Feyisa Reply
Answer
Feyisa
c
Jabir
the market for lemon has 10 potential consumers, each having an individual demand curve p=101-10Qi, where p is price in dollar's per cup and Qi is the number of cups demanded per week by the i th consumer.Find the market demand curve using algebra. Draw an individual demand curve and the market dema
Gsbwnw Reply
suppose the production function is given by ( L, K)=L¼K¾.assuming capital is fixed find APL and MPL. consider the following short run production function:Q=6L²-0.4L³ a) find the value of L that maximizes output b)find the value of L that maximizes marginal product
Abdureman
Got questions? Join the online conversation and get instant answers!
Jobilize.com Reply

Get Jobilize Job Search Mobile App in your pocket Now!

Get it on Google Play Download on the App Store Now


Source:  OpenStax, Astronomy. OpenStax CNX. Apr 12, 2017 Download for free at http://cnx.org/content/col11992/1.13
Google Play and the Google Play logo are trademarks of Google Inc.

Notification Switch

Would you like to follow the 'Astronomy' conversation and receive update notifications?

Ask