<< Chapter < Page Chapter >> Page >

Flares and coronal mass ejections

The most violent event on the surface of the Sun is a rapid eruption called a solar flare    ( [link] ). A typical flare lasts for 5 to 10 minutes and releases a total amount of energy equivalent to that of perhaps a million hydrogen bombs. The largest flares last for several hours and emit enough energy to power the entire United States at its current rate of electrical consumption for 100,000 years. Near sunspot maximum, small flares occur several times per day, and major ones may occur every few weeks.

Solar flare.

An image of a solar flare, a bright region to the right of the sun.
The bright white area seen on the right side of the Sun in this image from the Solar Dynamics Observer spacecraft is a solar flare that was observed on June 25, 2015. (credit: NASA/SDO)

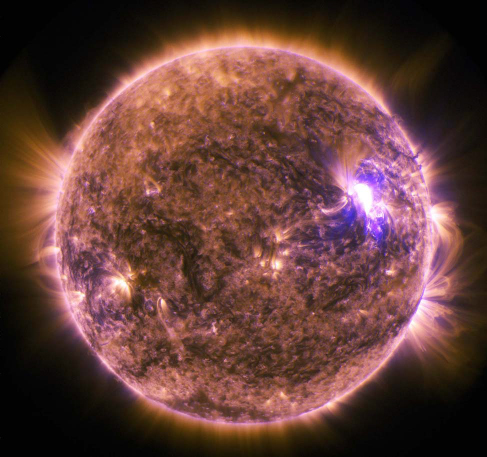
Flares, like the one shown in [link] , are often observed in the red light of hydrogen, but the visible emission is only a tiny fraction of the energy released when a solar flare explodes. At the moment of the explosion, the matter associated with the flare is heated to temperatures as high as 10 million K. At such high temperatures, a flood of X-ray and ultraviolet radiation is emitted.

Flares seem to occur when magnetic fields pointing in opposite directions release energy by interacting with and destroying each other—much as a stretched rubber band releases energy when it breaks.

What is different about flares is that their magnetic interactions cover a large volume in the solar corona and release a tremendous amount of electromagnetic radiation. In some cases, immense quantities of coronal material—mainly protons and electrons—may also be ejected at high speeds (500–1000 kilometers per second) into interplanetary space. Such a coronal mass ejection (CME)    can affect Earth in a number of ways (which we will discuss in the section on space weather).

Flare and coronal mass ejection.

A figure of a flare and a coronal mass ejection, shown in a series of four images. On the left is a view of the sun with a few dark sunspots. Next is a view of the sun in UV light, with a bright flare at the same location of the sunspots in the leftmost image. Next is an image of a coronal mass ejection shooting out from the same location. Finally the coronal mass ejection is imaged through a filter to show the emission from the corona.
This sequence of four images shows the evolution over time of a giant eruption on the Sun. (a) The event began at the location of a sunspot group, and (b) a flare is seen in far-ultraviolet light. (c) Fourteen hours later, a CME is seen blasting out into space. (d) Three hours later, this CME has expanded to form a giant cloud of particles escaping from the Sun and is beginning the journey out into the solar system. The white circle in (c) and (d) shows the diameter of the solar photosphere. The larger dark area shows where light from the Sun has been blocked out by a specially designed instrument to make it possible to see the faint emission from the corona. (credit a, b, c, d: modification of work by SOHO/EIT, SOHO/LASCO, SOHO/MDI (ESA&NASA))

Active regions

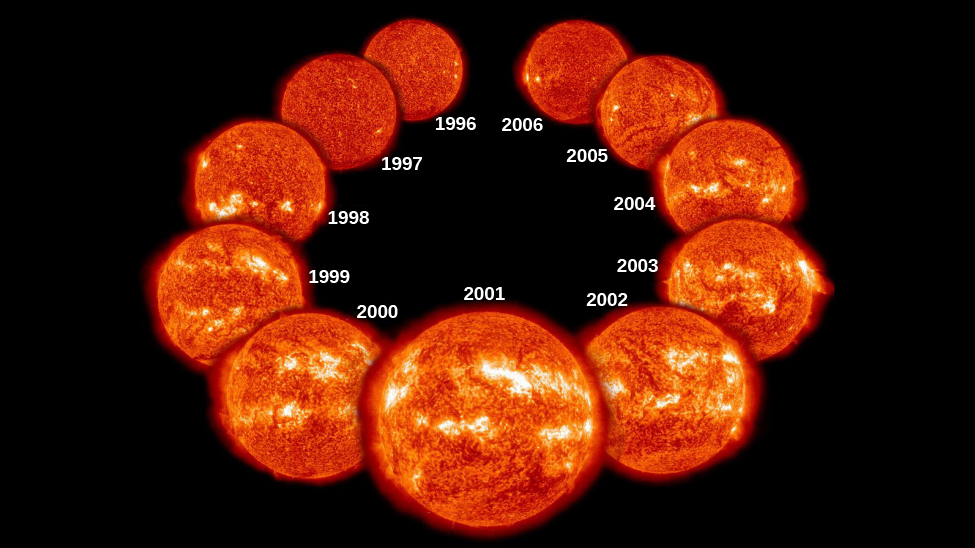
To bring the discussion of the last two sections together, astronomers now realize that sunspots, flares, and bright regions in the chromosphere and corona tend to occur together on the Sun in time and space. That is, they all tend to have similar longitudes and latitudes, but they are located at different heights in the atmosphere. Because they all occur together, they vary with the sunspot cycle.

Solar cycle.

A figure illustrating the solar cycle. Eleven separate images of the sun are shown from 1996 to 2006, demonstrating the changing active regions.
This dramatic sequence of images taken from the SOHO satellite over a period of 11 years shows how active regions change during the solar cycle . The images were taken in the ultraviolet region of the spectrum and show that active regions on the Sun increase and decrease during the cycle. Sunspots are located in the cooler photosphere, beneath the hot gases shown in this image, and vary in phase with the emission from these hot gases—more sunspots and more emission from hot gases occur together. (credit: modification of work by ESA/NASA/SOHO)

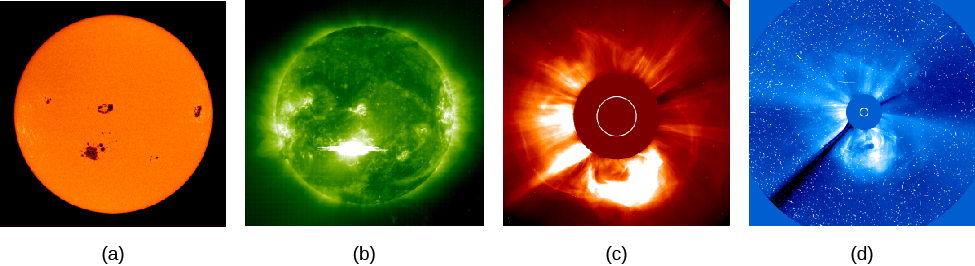
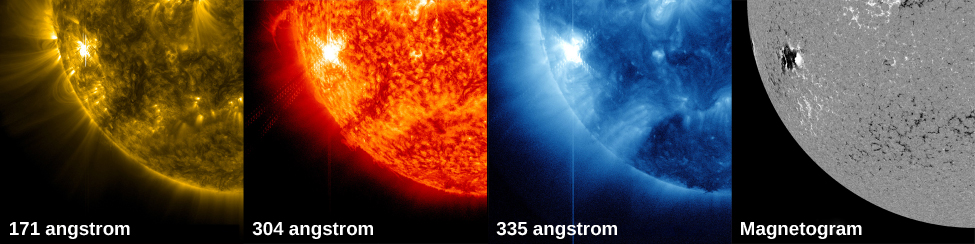
For example, flares are more likely to occur near sunspot maximum, and the corona is much more conspicuous at that time (see [link] ). A place on the Sun where a number of these phenomena are seen is called an active region    ( [link] ). As you might deduce from our earlier discussion, active regions are always associated with strong magnetic fields.

Solar active region observed at different heights in the sun’s atmosphere.

A figure illustrating a solar active region observed at different heights in the sun’s atmosphere. At 171 Angstrom, loops in the corona are shown. At 304 Angstrom, the bright light of a flare is shown. At 335 Angstrom, radiation from active regions in the corona is shown. A magnetogram shows the light and dark spots of directional magnetism.
These four images of a solar flare on October 22, 2012, show from the left: light from the Sun at a wavelength of 171 angstroms, which shows the structure of loops of solar material in the corona; ultraviolet at 304 angstroms, which shows light from the region of the Sun’s atmosphere where flares originate; light at 335 angstroms, which highlights radiation from active regions in the corona; a magnetogram, which shows magnetically active regions on the Sun. Note how these different types of activity all occur above a sunspot region with a strong magnetic field. (credit: modification of work by NASA/SDO/Goddard)

Key concepts and summary

Signs of more intense solar activity, an increase in the number of sunspots, as well as prominences, plages, solar flares, and c oronal mass ejections, all tend to occur in active regions—that is, in places on the Sun with the same latitude and longitude but at different heights in the atmosphere. Active regions vary with the solar cycle, just like sunspots do.

Practice Key Terms 5

Get Jobilize Job Search Mobile App in your pocket Now!

Get it on Google Play Download on the App Store Now


Source:  OpenStax, Astronomy. OpenStax CNX. Apr 12, 2017 Download for free at http://cnx.org/content/col11992/1.13
Google Play and the Google Play logo are trademarks of Google Inc.

Notification Switch

Would you like to follow the 'Astronomy' conversation and receive update notifications?

Ask