<< Chapter < Page Chapter >> Page >

Astronomers have also looked for evidence of dark matter in the region of the Milky Way Galaxy that lies within a few hundred light-years of the Sun. In this vicinity, most of the stars are restricted to a thin disk. It is possible to calculate how much mass the disk must contain in order to keep the stars from wandering far above or below it. The total matter that must be in the disk is less than twice the amount of luminous matter. This means that no more than half of the mass in the region near the Sun can be dark matter.

Dark matter in and around galaxies

In contrast to our local neighborhood near the Sun and solar system, there is (as we saw in The Milky Way Galaxy ) ample evidence strongly suggesting that about 90% of the mass in the entire galaxy is in the form of a halo of dark matter. In other words, there is apparently about nine times more dark matter than visible matter. Astronomers have found some stars in the outer regions of the Milky Way beyond its bright disk, and these stars are revolving very rapidly around its center. The mass contained in all the stars and all the interstellar matter we can detect in the galaxy does not exert enough gravitational force to explain how those fast-moving stars remain in their orbits and do not fly away. Only by having large amounts of unseen matter could the galaxy be holding on to those fast-moving outer stars. The same result is found for other spiral galaxies as well.

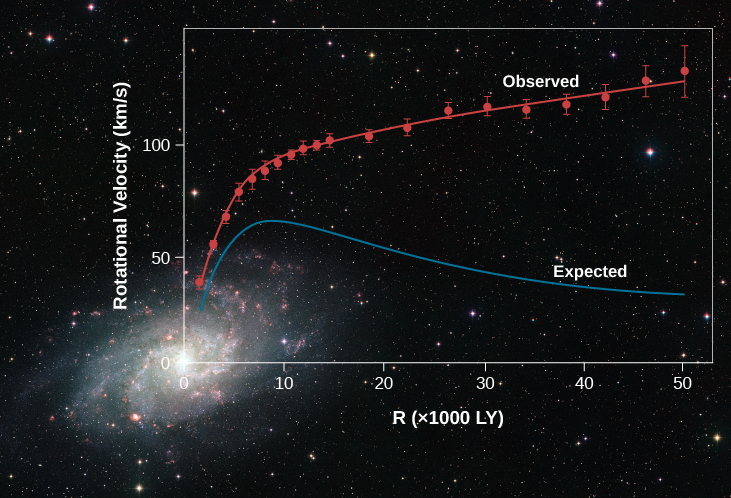
[link] is an example of the kinds of observations astronomers are making, for the Andromeda galaxy, a member of our Local Group. The observed rotation of spiral galaxies like Andromeda is usually seen in plots, known as rotation curves, that show velocity versus distance from the galaxy center. Such plots suggest that the dark matter is found in a large halo surrounding the luminous parts of each galaxy. The radius of the halos around the Milky Way and Andromeda may be as large as 300,000 light-years, much larger than the visible size of these galaxies.

Rotation indicates dark matter.

In this plot the vertical axis is labeled “Rotational Velocity (km/s)”, ranging from zero at bottom to 150 at top, in 50 km/s increments. The horizontal axis is labeled “R (x1000 LY)”, ranging from zero at left to 50 at right, in increments of 10. Observational data points are shown in red, with a red curve (labeled “Observed”) connecting them. Minimum velocity is about 40 km/s near R=zero, rises sharply to about 90 km/s near R ~ 8, and slowly continues to rise to about 120 km/s at R = 50. A blue curve, labeled “Expected”, shows the velocity curve expected with just the mass of stars alone. The blue curve peaks at about 70 km/s at R ~ 8, the falls off to about 40 km/s at R=50. The background image is that of M31, with the origin of the plot placed at the center of the galaxy.
We see the Milky Way’s sister, the spiral Andromeda galaxy, with a graph that shows the velocity at which stars and clouds of gas orbit the galaxy at different distances from the center (red line). As is true of the Milky Way, the rotational velocity (or orbital speed) does not decrease with distance from the center, which is what you would expect if an assembly of objects rotates around a common center. A calculation (blue line) based on the total mass visible as stars, gas, and dust predicts that the velocity should be much lower at larger distances from the center. The discrepancy between the two curves implies the presence of a halo of massive dark matter extending outside the boundary of the luminous matter. This dark matter causes everything in the galaxy to orbit faster than the observed matter alone could explain. (credit background: modification of work by ESO)

Dark matter in clusters of galaxies

Galaxies in clusters also move around: they orbit the cluster’s center of mass. It is not possible for us to follow a galaxy around its entire orbit because that typically takes about a billion years. It is possible, however, to measure the velocities with which galaxies in a cluster are moving, and then estimate what the total mass in the cluster must be to keep the individual galaxies from flying out of the cluster. The observations indicate that the mass of the galaxies alone cannot keep the cluster together—some other gravity must again be present. The total amount of dark matter in clusters exceeds by more than ten times the luminous mass contained within the galaxies themselves, indicating that dark matter    exists between galaxies as well as inside them.

Questions & Answers

What is inflation
Bright Reply
a general and ongoing rise in the level of prices in an economy
AI-Robot
What are the factors that affect demand for a commodity
Florence Reply
differentiate between demand and supply giving examples
Lambiv Reply
differentiated between demand and supply using examples
Lambiv
what is labour ?
Lambiv
how will I do?
Venny Reply
how is the graph works?I don't fully understand
Rezat Reply
information
Eliyee
devaluation
Eliyee
t
WARKISA
hi guys good evening to all
Lambiv
multiple choice question
Aster Reply
appreciation
Eliyee
explain perfect market
Lindiwe Reply
In economics, a perfect market refers to a theoretical construct where all participants have perfect information, goods are homogenous, there are no barriers to entry or exit, and prices are determined solely by supply and demand. It's an idealized model used for analysis,
Ezea
What is ceteris paribus?
Shukri Reply
other things being equal
AI-Robot
When MP₁ becomes negative, TP start to decline. Extuples Suppose that the short-run production function of certain cut-flower firm is given by: Q=4KL-0.6K2 - 0.112 • Where is quantity of cut flower produced, I is labour input and K is fixed capital input (K-5). Determine the average product of lab
Kelo
Extuples Suppose that the short-run production function of certain cut-flower firm is given by: Q=4KL-0.6K2 - 0.112 • Where is quantity of cut flower produced, I is labour input and K is fixed capital input (K-5). Determine the average product of labour (APL) and marginal product of labour (MPL)
Kelo
yes,thank you
Shukri
Can I ask you other question?
Shukri
what is monopoly mean?
Habtamu Reply
What is different between quantity demand and demand?
Shukri Reply
Quantity demanded refers to the specific amount of a good or service that consumers are willing and able to purchase at a give price and within a specific time period. Demand, on the other hand, is a broader concept that encompasses the entire relationship between price and quantity demanded
Ezea
ok
Shukri
how do you save a country economic situation when it's falling apart
Lilia Reply
what is the difference between economic growth and development
Fiker Reply
Economic growth as an increase in the production and consumption of goods and services within an economy.but Economic development as a broader concept that encompasses not only economic growth but also social & human well being.
Shukri
production function means
Jabir
What do you think is more important to focus on when considering inequality ?
Abdisa Reply
any question about economics?
Awais Reply
sir...I just want to ask one question... Define the term contract curve? if you are free please help me to find this answer 🙏
Asui
it is a curve that we get after connecting the pareto optimal combinations of two consumers after their mutually beneficial trade offs
Awais
thank you so much 👍 sir
Asui
In economics, the contract curve refers to the set of points in an Edgeworth box diagram where both parties involved in a trade cannot be made better off without making one of them worse off. It represents the Pareto efficient allocations of goods between two individuals or entities, where neither p
Cornelius
In economics, the contract curve refers to the set of points in an Edgeworth box diagram where both parties involved in a trade cannot be made better off without making one of them worse off. It represents the Pareto efficient allocations of goods between two individuals or entities,
Cornelius
Suppose a consumer consuming two commodities X and Y has The following utility function u=X0.4 Y0.6. If the price of the X and Y are 2 and 3 respectively and income Constraint is birr 50. A,Calculate quantities of x and y which maximize utility. B,Calculate value of Lagrange multiplier. C,Calculate quantities of X and Y consumed with a given price. D,alculate optimum level of output .
Feyisa Reply
Answer
Feyisa
c
Jabir
Got questions? Join the online conversation and get instant answers!
Jobilize.com Reply
Practice Key Terms 3

Get Jobilize Job Search Mobile App in your pocket Now!

Get it on Google Play Download on the App Store Now


Source:  OpenStax, Astronomy. OpenStax CNX. Apr 12, 2017 Download for free at http://cnx.org/content/col11992/1.13
Google Play and the Google Play logo are trademarks of Google Inc.

Notification Switch

Would you like to follow the 'Astronomy' conversation and receive update notifications?

Ask