<< Chapter < Page Chapter >> Page >

Learning objectives

By the end of this section, you will be able to:

  • Explain why it’s difficult to learn about Venus from Earth-based observation alone
  • Describe the history of our interest in Mars before the Space Age
  • Compare the basic physical properties of Earth, Mars, and Venus, including their orbits

As you might expect from close neighbors, Mars and Venus are among the brightest objects in the night sky. The average distance of Mars from the Sun is 227 million kilometers (1.52 AU), or about half again as far from the Sun as Earth. Venus’ orbit is very nearly circular, at a distance of 108 million kilometers (0.72 AU) from the Sun. Like Mercury, Venus sometimes appears as an “evening star” and sometimes as a “morning star.” Venus approaches Earth more closely than does any other planet: at its nearest, it is only 40 million kilometers from us. The closest Mars ever gets to Earth is about 56 million kilometers.

Appearance

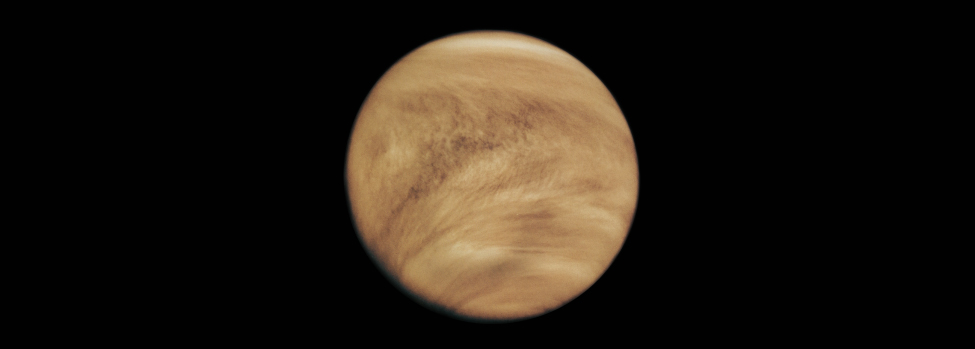
Venus appears very bright, and even a small telescope reveals that it goes through phases like the Moon. Galileo discovered that Venus displays a full range of phases, and he used this as an argument to show that Venus must circle the Sun and not Earth. The planet’s actual surface is not visible because it is shrouded by dense clouds that reflect about 70% of the sunlight that falls on them, frustrating efforts to study the underlying surface, even with cameras in orbit around the planet ( [link] ).

Venus as photographed by the pioneer venus orbiter.

Image of Venus in ultraviolet light. Only cloud-tops, which cover the entire planet, are visible in this image.
This ultraviolet image shows an upper-atmosphere cloud structure that would be invisible at visible wavelengths. Note that there is not even a glimpse of the planet’s surface. (credit: modification of work by NASA)

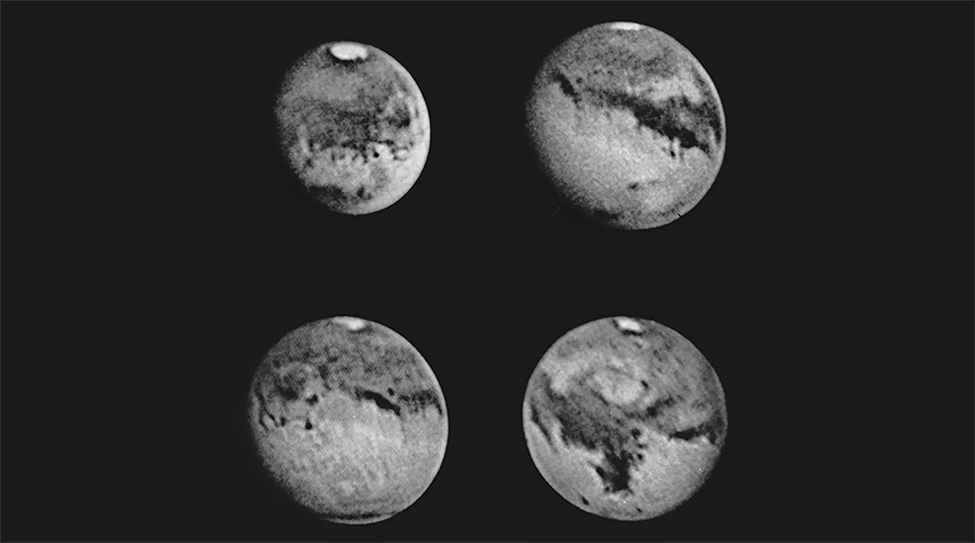
In contrast, Mars is more tantalizing as seen through a telescope ( [link] ). The planet is distinctly red, due (as we now know) to the presence of iron oxides in its soil. This color may account for its association with war (and blood) in the legends of early cultures. The best resolution obtainable from telescopes on the ground is about 100 kilometers, or about the same as what we can see on the Moon with the unaided eye. At this resolution, no hint of topographic structure can be detected: no mountains, no valleys, not even impact craters. On the other hand, bright polar ice caps can be seen easily, together with dusky surface markings that sometimes change in outline and intensity from season to season.

Mars as seen from earth’s surface.

The entire surface of Mars in four photographs. The white polar ice cap is visible at the top of each image along with several cloud formations and dark surface markings.
These are among the best Earth-based photos of Mars , taken in 1988 when the planet was exceptionally close to Earth. The polar caps and dark surface markings are evident, but not topographic features. (credit: modification of work by Steve Larson, Lunar and Planetary Laboratory, University of Arizona)

For a few decades around the turn of the twentieth century, some astronomers believed that they saw evidence of an intelligent civilization on Mars. The controversy began in 1877, when Italian astronomer Giovanni Schiaparelli (1835–1910) announced that he could see long, faint, straight lines on Mars that he called canale , or channels. In English-speaking countries, the term was mistakenly translated as “canals,” implying an artificial origin.

Questions & Answers

differentiate between demand and supply giving examples
Lambiv Reply
differentiated between demand and supply using examples
Lambiv
what is labour ?
Lambiv
how will I do?
Venny Reply
how is the graph works?I don't fully understand
Rezat Reply
information
Eliyee
devaluation
Eliyee
t
WARKISA
hi guys good evening to all
Lambiv
multiple choice question
Aster Reply
appreciation
Eliyee
explain perfect market
Lindiwe Reply
In economics, a perfect market refers to a theoretical construct where all participants have perfect information, goods are homogenous, there are no barriers to entry or exit, and prices are determined solely by supply and demand. It's an idealized model used for analysis,
Ezea
What is ceteris paribus?
Shukri Reply
other things being equal
AI-Robot
When MP₁ becomes negative, TP start to decline. Extuples Suppose that the short-run production function of certain cut-flower firm is given by: Q=4KL-0.6K2 - 0.112 • Where is quantity of cut flower produced, I is labour input and K is fixed capital input (K-5). Determine the average product of lab
Kelo
Extuples Suppose that the short-run production function of certain cut-flower firm is given by: Q=4KL-0.6K2 - 0.112 • Where is quantity of cut flower produced, I is labour input and K is fixed capital input (K-5). Determine the average product of labour (APL) and marginal product of labour (MPL)
Kelo
yes,thank you
Shukri
Can I ask you other question?
Shukri
what is monopoly mean?
Habtamu Reply
What is different between quantity demand and demand?
Shukri Reply
Quantity demanded refers to the specific amount of a good or service that consumers are willing and able to purchase at a give price and within a specific time period. Demand, on the other hand, is a broader concept that encompasses the entire relationship between price and quantity demanded
Ezea
ok
Shukri
how do you save a country economic situation when it's falling apart
Lilia Reply
what is the difference between economic growth and development
Fiker Reply
Economic growth as an increase in the production and consumption of goods and services within an economy.but Economic development as a broader concept that encompasses not only economic growth but also social & human well being.
Shukri
production function means
Jabir
What do you think is more important to focus on when considering inequality ?
Abdisa Reply
any question about economics?
Awais Reply
sir...I just want to ask one question... Define the term contract curve? if you are free please help me to find this answer 🙏
Asui
it is a curve that we get after connecting the pareto optimal combinations of two consumers after their mutually beneficial trade offs
Awais
thank you so much 👍 sir
Asui
In economics, the contract curve refers to the set of points in an Edgeworth box diagram where both parties involved in a trade cannot be made better off without making one of them worse off. It represents the Pareto efficient allocations of goods between two individuals or entities, where neither p
Cornelius
In economics, the contract curve refers to the set of points in an Edgeworth box diagram where both parties involved in a trade cannot be made better off without making one of them worse off. It represents the Pareto efficient allocations of goods between two individuals or entities,
Cornelius
Suppose a consumer consuming two commodities X and Y has The following utility function u=X0.4 Y0.6. If the price of the X and Y are 2 and 3 respectively and income Constraint is birr 50. A,Calculate quantities of x and y which maximize utility. B,Calculate value of Lagrange multiplier. C,Calculate quantities of X and Y consumed with a given price. D,alculate optimum level of output .
Feyisa Reply
Answer
Feyisa
c
Jabir
the market for lemon has 10 potential consumers, each having an individual demand curve p=101-10Qi, where p is price in dollar's per cup and Qi is the number of cups demanded per week by the i th consumer.Find the market demand curve using algebra. Draw an individual demand curve and the market dema
Gsbwnw Reply
suppose the production function is given by ( L, K)=L¼K¾.assuming capital is fixed find APL and MPL. consider the following short run production function:Q=6L²-0.4L³ a) find the value of L that maximizes output b)find the value of L that maximizes marginal product
Abdureman
types of unemployment
Yomi Reply
What is the difference between perfect competition and monopolistic competition?
Mohammed
Got questions? Join the online conversation and get instant answers!
Jobilize.com Reply

Get Jobilize Job Search Mobile App in your pocket Now!

Get it on Google Play Download on the App Store Now


Source:  OpenStax, Astronomy. OpenStax CNX. Apr 12, 2017 Download for free at http://cnx.org/content/col11992/1.13
Google Play and the Google Play logo are trademarks of Google Inc.

Notification Switch

Would you like to follow the 'Astronomy' conversation and receive update notifications?

Ask