<< Chapter < Page Chapter >> Page >

Learning objectives

By the end of this section, you will be able to:

  • Describe the three basic components of a modern system for measuring astronomical sources
  • Describe the main functions of a telescope
  • Describe the two basic types of visible-light telescopes and how they form images

Systems for measuring radiation

There are three basic components of a modern system for measuring radiation from astronomical sources. First, there is a telescope    , which serves as a “bucket” for collecting visible light (or radiation at other wavelengths, as shown in ( [link] ). Just as you can catch more rain with a garbage can than with a coffee cup, large telescopes gather much more light than your eye can. Second, there is an instrument attached to the telescope that sorts the incoming radiation by wavelength. Sometimes the sorting is fairly crude. For example, we might simply want to separate blue light from red light so that we can determine the temperature of a star. But at other times, we want to see individual spectral lines to determine what an object is made of, or to measure its speed (as explained in the Radiation and Spectra chapter). Third, we need some type of detector    , a device that senses the radiation in the wavelength regions we have chosen and permanently records the observations.
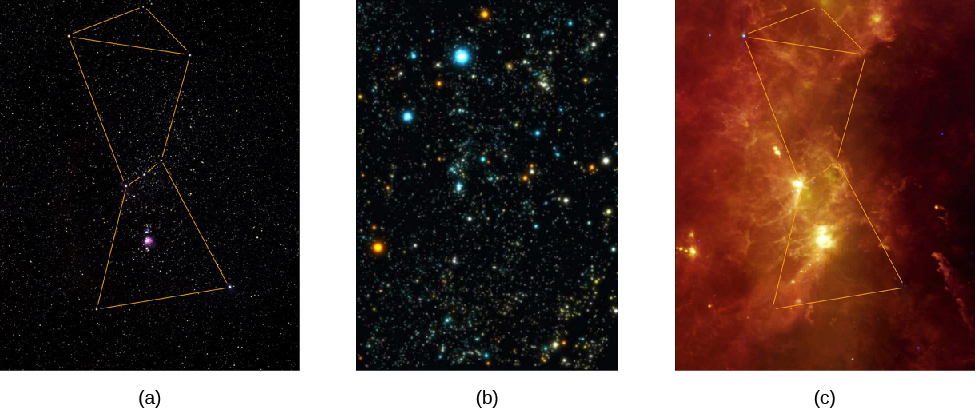
Orion region at different wavelengths.

Three images of the constellation of Orion in different wavelengths of light. On the left (a) is a visible light image, with straight lines connecting the bright stars to form the outline of the constellation, which is that of a man. Below the three stars that form Orion’s belt in the center of the image is the famous Orion nebula. Image (b) shows the same area in X-rays. As only a few of the stars seen in visible light are seen in X-rays, the outline of the constellation has been omitted. Numerous very bright stars and other distant sources are prominent. Lastly, on the right (c), is an infrared image. Some of the stars are visible, so the outline is again presented. The image is nearly covered with delicate wisps of nebulosity which get quite bright and dense in the vicinity of the Orion nebula.
The same part of the sky looks different when observed with instruments that are sensitive to different bands of the spectrum. (a) Visible light: this shows part of the Orion region as the human eye sees it, with dotted lines added to show the figure of the mythical hunter, Orion. (b) X-rays: here, the view emphasizes the point-like X-ray sources nearby. The colors are artificial, changing from yellow to white to blue with increasing energy of the X-rays. The bright, hot stars in Orion are still seen in this image, but so are many other objects located at very different distances, including other stars, star corpses, and galaxies at the edge of the observable universe. (c) Infrared radiation: here, we mainly see the glowing dust in this region. (credit a: modification of work by Howard McCallon/NASA/IRAS; credit b: modification of work by Howard McCallon/NASA/IRAS; credit c: modification of work by Michael F. Corcoran)

The history of the development of astronomical telescopes is about how new technologies have been applied to improve the efficiency of these three basic components: the telescopes, the wavelength-sorting device, and the detectors. Let’s first look at the development of the telescope.

Many ancient cultures built special sites for observing the sky ( [link] ). At these ancient observatories , they could measure the positions of celestial objects, mostly to keep track of time and date. Many of these ancient observatories had religious and ritual functions as well. The eye was the only device available to gather light, all of the colors in the light were observed at once, and the only permanent record of the observations was made by human beings writing down or sketching what they saw.

Questions & Answers

how do you get the 2/50
Abba Reply
number of sport play by 50 student construct discrete data
Aminu Reply
width of the frangebany leaves on how to write a introduction
Theresa Reply
Solve the mean of variance
Veronica Reply
Step 1: Find the mean. To find the mean, add up all the scores, then divide them by the number of scores. ... Step 2: Find each score's deviation from the mean. ... Step 3: Square each deviation from the mean. ... Step 4: Find the sum of squares. ... Step 5: Divide the sum of squares by n – 1 or N.
kenneth
what is error
Yakuba Reply
Is mistake done to something
Vutshila
Hy
anas
hy
What is the life teble
anas
hy
Jibrin
statistics is the analyzing of data
Tajudeen Reply
what is statics?
Zelalem Reply
how do you calculate mean
Gloria Reply
diveving the sum if all values
Shaynaynay
let A1,A2 and A3 events be independent,show that (A1)^c, (A2)^c and (A3)^c are independent?
Fisaye Reply
what is statistics
Akhisani Reply
data collected all over the world
Shaynaynay
construct a less than and more than table
Imad Reply
The sample of 16 students is taken. The average age in the sample was 22 years with astandard deviation of 6 years. Construct a 95% confidence interval for the age of the population.
Aschalew Reply
Bhartdarshan' is an internet-based travel agency wherein customer can see videos of the cities they plant to visit. The number of hits daily is a normally distributed random variable with a mean of 10,000 and a standard deviation of 2,400 a. what is the probability of getting more than 12,000 hits? b. what is the probability of getting fewer than 9,000 hits?
Akshay Reply
Bhartdarshan'is an internet-based travel agency wherein customer can see videos of the cities they plan to visit. The number of hits daily is a normally distributed random variable with a mean of 10,000 and a standard deviation of 2,400. a. What is the probability of getting more than 12,000 hits
Akshay
1
Bright
Sorry i want to learn more about this question
Bright
Someone help
Bright
a= 0.20233 b=0.3384
Sufiyan
a
Shaynaynay
How do I interpret level of significance?
Mohd Reply
It depends on your business problem or in Machine Learning you could use ROC- AUC cruve to decide the threshold value
Shivam
how skewness and kurtosis are used in statistics
Owen Reply
yes what is it
Taneeya
Got questions? Join the online conversation and get instant answers!
Jobilize.com Reply
Practice Key Terms 9

Get Jobilize Job Search Mobile App in your pocket Now!

Get it on Google Play Download on the App Store Now


Source:  OpenStax, Astronomy. OpenStax CNX. Apr 12, 2017 Download for free at http://cnx.org/content/col11992/1.13
Google Play and the Google Play logo are trademarks of Google Inc.

Notification Switch

Would you like to follow the 'Astronomy' conversation and receive update notifications?

Ask