

| << Chapter < Page | Chapter >> Page > |
By the end of this section, you will be able to:
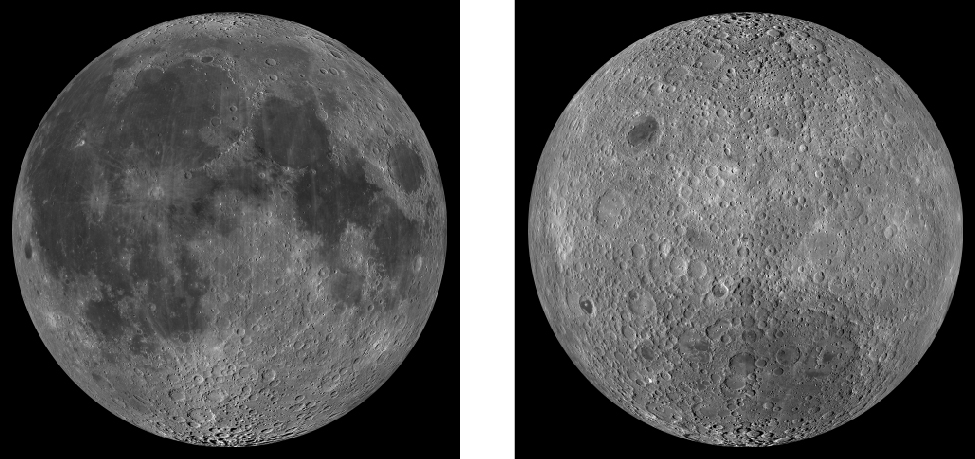
The Moon has only one-eightieth the mass of Earth and about one-sixth Earth’s surface gravity—too low to retain an atmosphere ( [link] ). Moving molecules of a gas can escape from a planet just the way a rocket does, and the lower the gravity, the easier it is for the gas to leak away into space. While the Moon can acquire a temporary atmosphere from impacting comets, this atmosphere is quickly lost by freezing onto the surface or by escape to surrounding space. The Moon today is dramatically deficient in a wide range of volatiles , those elements and compounds that evaporate at relatively low temperatures. Some of the Moon’s properties are summarized in [link] , along with comparative values for Mercury .
| Properties of the Moon and Mercury | ||
|---|---|---|
| Property | Moon | Mercury |
| Mass (Earth = 1) | 0.0123 | 0.055 |
| Diameter (km) | 3476 | 4878 |
| Density (g/cm 3 ) | 3.3 | 5.4 |
| Surface gravity (Earth = 1) | 0.17 | 0.38 |
| Escape velocity (km/s) | 2.4 | 4.3 |
| Rotation period (days) | 27.3 | 58.65 |
| Surface area (Earth = 1) | 0.27 | 0.38 |
Most of what we know about the Moon today derives from the US Apollo program , which sent nine piloted spacecraft to our satellite between 1968 and 1972, landing 12 astronauts on its surface ( [link] ). Before the era of spacecraft studies, astronomers had mapped the side of the Moon that faces Earth with telescopic resolution of about 1 kilometer, but lunar geology hardly existed as a scientific subject. All that changed beginning in the early 1960s. Initially, Russia took the lead in lunar exploration with Luna 3, which returned the first photos of the lunar far side in 1959, and then with Luna 9, which landed on the surface in 1966 and transmitted pictures and other data to Earth. However, these efforts were overshadowed on July 20, 1969, when the first American astronaut set foot on the Moon.
[link] summarizes the nine Apollo flights: six that landed and three others that circled the Moon but did not land. The initial landings were on flat plains selected for safety reasons. But with increasing experience and confidence, NASA targeted the last three missions to more geologically interesting locales. The level of scientific exploration also increased with each mission, as the astronauts spent longer times on the Moon and carried more elaborate equipment. Finally, on the last Apollo landing, NASA included one scientist, geologist Jack Schmitt, among the astronauts ( [link] ).
| Apollo Flights to the Moon | |||
|---|---|---|---|
| Flight | Date | Landing Site | Main Accomplishment |
| Apollo 8 | Dec. 1968 | — | First humans to fly around the Moon |
| Apollo 10 | May 1969 | — | First spacecraft rendezvous in lunar orbit |
| Apollo 11 | July 1969 | Mare Tranquillitatis | First human landing on the Moon; 22 kilograms of samples returned |
| Apollo 12 | Nov. 1969 | Oceanus Procellarum | First Apollo Lunar Surface Experiment Package (ALSEP); visit to Surveyor 3 lander |
| Apollo 13 | Apr. 1970 | — | Landing aborted due to explosion in command module |
| Apollo 14 | Jan. 1971 | Mare Nubium | First “rickshaw” on the Moon |
| Apollo 15 | July 1971 | Mare Imbrium/Hadley | First “rover;” visit to Hadley Rille; astronauts traveled 24 kilometers |
| Apollo 16 | Apr. 1972 | Descartes | First landing in highlands; 95 kilograms of samples returned |
| Apollo 17 | Dec. 1972 | Taurus-Littrow highlands | Geologist among the crew; 111 kilograms of samples returned |
Notification Switch
Would you like to follow the 'Astronomy' conversation and receive update notifications?

|
|

|
|

|
|

|
|

|
|

|
|
|
|
|

|
|

|
|

|