<< Chapter < Page Chapter >> Page >

Learning objectives

By the end of this section, you will be able to:

  • Describe how interstellar matter is arranged around our solar system
  • Explain why scientists think that the Sun is located in a hot bubble

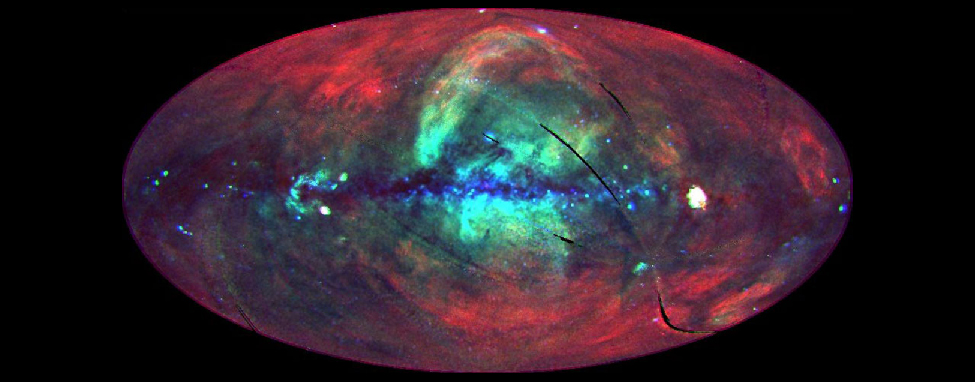
We want to conclude our discussion of interstellar matter by asking how this material is organized in our immediate neighborhood. As we discussed above, orbiting X-ray observatories have shown that the Galaxy is full of bubbles of hot, X-ray-emitting gas. They also revealed a diffuse background of X-rays that appears to fill the entire sky from our perspective ( [link] ). While some of this emission comes from the interaction of the solar wind with the interstellar medium, a majority of it comes from beyond the solar system. The natural explanation for why there is X-ray-emitting gas all around us is that the Sun is itself inside one of the bubbles. We therefore call our “neighborhood” the Local Hot Bubble, or Local Bubble    for short. The Local Bubble is much less dense—an average of approximately 0.01 atoms per cm 3 —than the average interstellar density of about 1 atom per cm 3 . This local gas has a temperature of about a million degrees, just like the gas in the other superbubbles that spread throughout our Galaxy, but because there is so little hot material, this high temperature does not affect the stars or planets in the area in any way.

What caused the Local Bubble to form? Scientists are not entirely sure, but the leading candidate is winds from stars and supernova explosions. In a nearby region in the direction of the constellations Scorpius and Centaurus, a lot of star formation took place about 15 million years ago. The most massive of these stars evolved very quickly until they produced strong winds, and some ended their lives by exploding. These processes filled the region around the Sun with hot gas, driving away cooler, denser gas. The rim of this expanding superbubble reached the Sun about 7.6 million years ago and now lies more than 200 light-years past the Sun in the general direction of the constellations of Orion, Perseus, and Auriga.

Sky in x-rays.

In this image of the X-ray sky the dark, dusty plane of the Milky Way runs from left to right across the center of the picture. Blue light (1.5 keV) is scattered all along the lower portion of the dark band of the Milky Way. At center, extending above and below the dark band is a circular region of green (0.75 keV), and covering the entire image is the red glow of 0.25 keV X-rays.
This image, made by the ROSAT satellite, shows the whole sky in X-rays as seen from Earth. Different colors indicate different X-ray energies: red is 0.25 kiloelectron volts, green is 0.75 kiloelectron volts, and blue is 1.5 kiloelectron volts. The image is oriented so the plane of the Galaxy runs across the middle of the image. The ubiquitous red color, which does not disappear completely even in the galactic plane, is evidence for a source of X-rays all around the Sun. (credit: modification of work by NASA)

A few clouds of interstellar matter do exist within the Local Bubble. The Sun itself seems to have entered a cloud about 10,000 years ago. This cloud is warm (with a temperature of about 7000 K) and has a density of 0.3 hydrogen atom per cm 3 —higher than most of the Local Bubble but still so tenuous that it is also referred to as Local Fluff    ( [link] ). (Aren’t these astronomical names fun sometimes?)

While this is a pretty thin cloud, we estimate that it contributes 50 to 100 times more particles than the solar wind to the diffuse material between the planets in our solar system. These interstellar particles have been detected and their numbers counted by the spacecraft traveling between the planets. Perhaps someday, scientists will devise a way to collect them without destroying them and to return them to Earth, so that we can touch—or at least study in our laboratories—these messengers from distant stars.

Questions & Answers

how do you get the 2/50
Abba Reply
number of sport play by 50 student construct discrete data
Aminu Reply
width of the frangebany leaves on how to write a introduction
Theresa Reply
Solve the mean of variance
Veronica Reply
Step 1: Find the mean. To find the mean, add up all the scores, then divide them by the number of scores. ... Step 2: Find each score's deviation from the mean. ... Step 3: Square each deviation from the mean. ... Step 4: Find the sum of squares. ... Step 5: Divide the sum of squares by n – 1 or N.
kenneth
what is error
Yakuba Reply
Is mistake done to something
Vutshila
Hy
anas
hy
What is the life teble
anas
hy
Jibrin
statistics is the analyzing of data
Tajudeen Reply
what is statics?
Zelalem Reply
how do you calculate mean
Gloria Reply
diveving the sum if all values
Shaynaynay
let A1,A2 and A3 events be independent,show that (A1)^c, (A2)^c and (A3)^c are independent?
Fisaye Reply
what is statistics
Akhisani Reply
data collected all over the world
Shaynaynay
construct a less than and more than table
Imad Reply
The sample of 16 students is taken. The average age in the sample was 22 years with astandard deviation of 6 years. Construct a 95% confidence interval for the age of the population.
Aschalew Reply
Bhartdarshan' is an internet-based travel agency wherein customer can see videos of the cities they plant to visit. The number of hits daily is a normally distributed random variable with a mean of 10,000 and a standard deviation of 2,400 a. what is the probability of getting more than 12,000 hits? b. what is the probability of getting fewer than 9,000 hits?
Akshay Reply
Bhartdarshan'is an internet-based travel agency wherein customer can see videos of the cities they plan to visit. The number of hits daily is a normally distributed random variable with a mean of 10,000 and a standard deviation of 2,400. a. What is the probability of getting more than 12,000 hits
Akshay
1
Bright
Sorry i want to learn more about this question
Bright
Someone help
Bright
a= 0.20233 b=0.3384
Sufiyan
a
Shaynaynay
How do I interpret level of significance?
Mohd Reply
It depends on your business problem or in Machine Learning you could use ROC- AUC cruve to decide the threshold value
Shivam
how skewness and kurtosis are used in statistics
Owen Reply
yes what is it
Taneeya
Got questions? Join the online conversation and get instant answers!
Jobilize.com Reply

Get Jobilize Job Search Mobile App in your pocket Now!

Get it on Google Play Download on the App Store Now


Source:  OpenStax, Astronomy. OpenStax CNX. Apr 12, 2017 Download for free at http://cnx.org/content/col11992/1.13
Google Play and the Google Play logo are trademarks of Google Inc.

Notification Switch

Would you like to follow the 'Astronomy' conversation and receive update notifications?

Ask